Chapter 10: Synthesize and Report Research
Kat Gray; Will Fleming; and Katrina Peterson
Introduction
To write the problem primer for Project 3, you will need to think about how to synthesize and report research. That is, you will need to think about how your sources talk to one another, and what those conversations mean, and how to talk about your research for a nonexpert audience. For this assignment, you will be talking to the advisory board of the UArk Cares Foundation – they do not know your topic intimately, but they have experience with prior community improvement projects, and they run the Community Improvement Grant contest yearly.
This chapter will show you how to use the information you have about your topic and your rhetorical situation to compose effective reports. It begins by discussing synthesis, an advanced writing skill that helps you use research to support and enhance your message. This section also reviews quotation, summary, and paraphrase as key research writing skills and gives tips for avoiding plagiarism. Next, the chapter explicates the problem primer document, beginning with a brief exploration of reports as a technical communication genre. Each section of the problem primer is then discussed in detail. The chapter closes with a section that gives basic skills for designing and integrating visuals into reports.
What is Synthesis?
Once technical writers collect research and evaluate their sources, they can begin writing, incorporating the knowledge they have gained from their source materials, whether primary, secondary, or tertiary. When technical writers utilize research in their projects, they use a skill called synthesis to bring together what they’ve learned from that research with their own skills, expertise, and rhetorical needs.
According to MacPháidín Library at Stonehill College, synthesis “refers to the process of combining ideas and arguments from multiple sources and analyzing them to provide new insights” (2025). Synthesis should “[organize] information in such a way that helps the reader make sense of the sources and better understand how they overlap” (2025). The Center for Scholarly Communication at Indiana University of Pennsylvania argues that synthesis accomplishes a wide variety of tasks: synthesis can be used not only to “interpret and analyze multiple sources,” but also to “compare, contrast, and make insightful connections to create a new whole” (n.d.). Synthesis is a higher-order thinking skill that helps you to communicate clearly, accurately, and persuasively with your readers.
Before you start writing your problem primer, it will be helpful to think about how your sources relate to one another. One way writers prepare for writing with research is to complete a synthesis chart. Below, in Table 10.1, you will see an example of how you might fill out such a chart, using growing traffic congestion in Northwest Arkansas as a sample topic[1].
| Themes | Source 1: Northwest Arkansas Regional Planning Commission Report | Source 2: City of Fayetteville Website – Planning Page | Source 3: Rogers City Council Meeting Minutes | Source 4: University of Arkansas Associated Student Government Annual Report | Source 5: City of Springdale Traffic Engineering Report |
| Theme 1: local population growth rates | all areas of NWA are experiencing population growth | influx of young and middle-aged people in the past decade | Walmart recruitment plans will mean a sharp increase in population in the coming years | growing student population in the past 5 years | more people using the roads inevitably means more roads to fix |
| Theme 2: traffic infrastructure | regional traffic infrastructure does not yet have the capacity to handle the predicted population growth | not enough walkable areas downtown for pedestrians, causing unsafe walking and driving conditions | parking at the AMP is limited to an extent that makes it difficult for event-goers to attend | challenges related to traffic congestion and on-campus parking | rising commute times due to congested interstate on-ramps during peak hours |
| Theme 3: public transportation infrastructure | reports plans for a light rail feasibility study, starting in two months | announcing a feasibility study for a consumer light-rail line connecting NWA population hubs, partnering with NWARPC | not enough bus/public transportation lines to other locations in NWA | most students have to live off campus, but find public transportation options limited or difficult to access | public transportation lines don’t run often enough in the evening |
| Theme 4: town and university relations | UArk and City of Fayetteville must plan together to handle increased demands on transportation infrastructure | city planners are working with university planners to plan a town hall meeting about projected population growth in the coming decade | n/a | n/a | n/a |
| Theme 5: long-term growth goals | discover long-term transportation solutions for a growing Northwest Arkansas | need to balance rising student population with rising overall population in the area | increase traffic capacity for concerts, sporting events, and other large-scale gatherings | n/a | come up with a sustainable road maintenance plan and expand interstate capacity |
You can find a blank chart like the one above at the Arkansas English Resource. Use it to prepare your thoughts for writing your problem primer.
Incorporating Sources in Technical Writing Documents[2]
When you are ready to write, you will want to think carefully about how to use the information you gathered during the research process. In particular, this means thinking about the stakeholders for your project, your audience (should they be different from your stakeholders), and their needs in terms of clear, accurate information. There are three common techniques for using sources in researched writing: Quoting, Summarizing,and Paraphrasing.
Quoting
A direct quotation is a word-for-word restatement of another author’s thoughts. The quote must match the original source word for word, and it should begin and end with quotation marks, which tells the reader that the information is directly quoted. Direct quotes are especially useful when the original writing is unique or difficult to summarize; when used effectively, they can also work to strengthen your support and credibility.
EXAMPLE:
According to the EPA’s assessment: “Lead can enter drinking water when service pipes that contain lead corrode, especially where the water has high acidity or low mineral content that corrodes pipes and fixtures.”
Source: "Basic information about lead in drinking water." EPA.gov.
Summarizing
Summaries are condensed versions of the original source, written in your own words. Summaries focus on the main ideas, but do not copy any of the original language. A 500 page book or a 2 hour movie could be summarized in a sentence. Summaries do not contain the same level of detail as the original source.
EXAMPLE:
Original text: “Lead can enter drinking water when service pipes that contain lead corrode, especially where the water has high acidity or low mineral content that corrodes pipes and fixtures. The most common problem is with brass or chrome-plated brass faucets and fixtures with lead solder, from which significant amounts of lead can enter into the water, especially hot water.”
Summarized text: Water becomes contaminated by lead when lead pipes, solder, or certain types of fixtures degrade, and hot water can increase the amount of lead released.
Source: "Basic information about lead in drinking water." EPA.gov.
Paraphrasing
Similar to summarizing, paraphrasing is a restatement of source material in your own words. The main difference is that paraphrasing tends to be closer in length to the original source. Paraphrases have the same (or nearly the same) level of detail as the original. Remember, though, if you copy from the original source even two or three words in a row, you must provide quotation marks around those words.
EXAMPLE:
Original passage: “Lead can enter drinking water when service pipes that contain lead corrode, especially where the water has high acidity or low mineral content that corrodes pipes and fixtures. The most common problem is with brass or chrome-plated brass faucets and fixtures with lead solder, from which significant amounts of lead can enter into the water, especially hot water.”
Paraphrased passage: Water becomes contaminated by lead when lead pipes or lead solder degrades. Certain types of fixtures, such as those plated with chrome and brass, as well as hot water, acidic water, and water with lower amounts of minerals can make lead contamination significantly worse.
"Basic information about lead in drinking water." EPA.gov.
Regardless of whether you choose to directly quote, summarize, or paraphrase a source, you must document the source material. Failure to do so properly could be viewed as plagiarism and can lead to allegations of academic or workplace dishonesty.
What is Plagiarism and How Can I Avoid It?
Plagiarism is the presentation of someone else’s work as your own. More formally stated, it is the act of claiming language, ideas, opinions, theories, software code, artistic material, or anything else developed by another person without acknowledging that person as the source of the material. Because of the ubiquity of information online and the ease with which we can cut and paste, it is very easy to commit plagiarism and not even be aware of doing so. But whether the plagiarism is intentional or unintentional, it is considered dishonest, unfair, and unethical.
Plagiarism is fairly easy to avoid as long as you pay close attention to how you integrate your source material and make sure that you give credit to the source when using someone else’s words or ideas. There are two ways to use someone’s ideas: you may use them word for word (verbatim) as a quote, or you may paraphrase or summarize the idea in your own words. Either way, the original author should be credited for their words or ideas (usually with an in-text citation – these may look different depending on which citation style you use).
Credit must always be given to others for:
-
-
- their words, either quoted or paraphrased;
- their artistic material (photos, charts, slideshows, etc.);
- and their research findings, analyses, and conclusions.
-
The best way to avoid plagiarism is to simply list the sources you used in preparing your work (many writers find it helpful to jot down or bookmark all their sources as they find them). You may not end up using all of your sources, but saving them as you work will save you a lot of trouble down the road.
Ethical Citation Tips
As you incorporate research into your writing, you can use the tips below to help you cite all of your sources ethically and appropriately.
- Cite while you write. To avoid missing citations, insert them while you are writing your document. Otherwise, you risk forgetting where you found a particular piece of information.
- Avoid copy/pasting from other sources. Lean on summary and paraphrase to reproduce someone else’s idea in your own words – you should still provide a citation for the original source. If you are quoting directly, remember to enclose the words in quotation marks.
- Use short quotations. Limit quotations to one or two key sentences. Further, limit the total number of quotations in your document. Choose them carefully and use them effectively.
- Cite images and photos. If you wish to use someone else’s visuals in your own documents, make sure you obtain permission. Many copyright holders will allow you to reuse imagery if you properly cite and attribute the original source. Follow the guidance of the copyright holder regarding the best wording to use for attribution.
- Be careful about reusing your own work. Reusing your own previous work or imagery is tricky. In the academic world, you might cite previous pieces to build on your prior work. However, in the professional world, you often give up copyright when you transfer your work to a publisher – and the writing you do for your employer almost always belongs to the company, not you as an individual.
Creating a Problem Primer
The problem primer you will write for Project 3 is a type of informational report, customized to suit the needs of our course. The report is a very common technical writing genre used in a wide variety of rhetorical situations in the professional and academic worlds. In this section, you’ll learn more about reports as a genre, then see a breakdown of the required parts of your problem primer assignment.
What is a Report?[3]
Reports are documents designed to record and convey information to the reader. The type of report is often identified by its primary purpose or function, as in an accident report, a laboratory report, a sales report, or even a book report. Reports are often analytical, or involve the rational analysis of information. Sometimes they simply report the facts with no analysis at all, but still need to communicate the information in a clear and concise format. Other reports summarize past events, present current data, and forecast future trends. A sales report, for example, is not designed to make an individual sale. It is, however, supposed to report sales to date, and may forecast future sales based on previous trends.
Types of Reports
The type of report you write depends on its function, or its purpose, often indicated in the thesis or purpose statement. The function will also influence the types of visual content or visual aids, which represent words, numbers, and their relationships to the report’s central purpose in graphics that are easy for the reader to understand. The function may also contribute to parameters like report length (page or word count) or word choice and readability.
Reports also vary by style and format. This section discusses reports in general terms, focusing on common elements. Referencing similar documents or specific report examples may serve you well as you prepare your own reports.
There are two main categories for reports, regardless of their specific function or type. An informational report informs or instructs by presenting details of events, activities, individuals, or conditions without analysis. An example of this type of report is a police accident report or a workplace incident report. The report will note the time, date, place, contributing factors, like weather, and identification of those involved. It does not establish fault or include judgmental statements. You should not see, for example, “Driver was falling down drunk” in a police accident report. Instead, you would see “Driver failed sobriety tests and breathalyzer test and was transported to the station for a blood sample.” The police officer is not a trained medical doctor and is therefore not licensed to make definitive diagnoses but can collect and present relevant information that may contribute to that diagnosis.
The second type of report is called an analytical report. An analytical report presents information with a comprehensive analysis to solve problems, demonstrate relationships, or make recommendations. An example of this report may be a field report by a Center for Disease Control (CDC) physician from the site of an outbreak of a virus, noting symptoms, disease progression, steps taken to arrest the spread of the disease, and recommendations for the treatment and quarantine of subjects.
Table 10.2 lists many common types of technical reports and their functions:
| Report Type | Report Function |
| Laboratory Report | Communicates the procedures and results of laboratory activities |
| Research Report | Studies problems by developing hypotheses, collecting and analyzing data, and indicating findings or conclusions |
| Field Study Report | Describes one-time events, such as trips, conferences, seminars, as well as reports from offices and industrial plants |
| Progress Report | Describes a project in progress, gives updates on milestones and benchmarks |
| Technical Report | Communicates processes and products from a technical perspective |
| Financial Report | Communicates status and trends from a financial perspective |
| Case Study | Represents, analyzes, and presents lessons learned from a specific case or example |
| Needs Assessment Report | Assesses the need for a service or product |
| Comparative Advantage Report | Discusses competing products or services with an analysis of relative advantages and disadvantages |
| Feasibility Study | Analyzes problems and predict whether current solutions or alternatives will be practical, advisable, or produced the desired outcome(s) |
| Instruction Manuals | Communicate step-by-step instructions on the use of a product or service |
| Compliance Report | Document and indicate the extent to which a product or service is within established compliance parameters or standards |
| Cost-Benefit Analysis Report | Communicate costs and benefits of products or services. |
| Decision Report | Make recommendations to management and become tools to solve problems and make decisions |
| Benchmark Report | Establish criteria and evaluate alternatives by measuring against the establish benchmark criteria |
| Examination Report | Report or record data obtained from an examination of an item or conditions, including accidents and natural disasters |
| Physical Description report | Describe the physical characteristics of a machine, a device, or object |
| Literature Review | Present summaries of the information available on a given subject |
Regardless of the type of report you write, you must consider your stakeholders – those who have an interest in the report. That may include the people the report is about, whom it is for, and the larger audience of the community, organization, or industry. Each element of the report supports the main purpose or function in its own way, playing an important role in the representation and transmission of information.
Composing a Problem Primer
Longer technical reports can take on many different forms (and names), but most, such as recommendation and evaluation reports, do essentially the same thing: they provide a careful study of a situation or problem, and often recommend options to improve that situation or problem. These are goals of the problem primer report you will create.
The structural principle fundamental to these types of reports is this: you provide not only possible recommendations, but also the data, analysis, discussion, and the conclusions leading to it. That way, readers can check your findings, your logic, and your conclusions to make sure your methodology was sound and that they can agree with your recommendation. Your goal is to create a document that helps your project group decide on a course of action to use for writing Project 4: the collaborative grant proposal. For your report to be most helpful in this way, you should use careful research, detailed analysis, and documentation.
When creating a report of any type, the general problem-solving approach works well for most technical reports; the steps below in Table 10.3, generally coincide with how you organize your report’s information.
| 1. Identify the need | What is the “unsatisfactory situation” that needs to be improved? |
| 2. Identify the criteria for responding to the need |
What is the overall goal? What are the specific, measurable objectives any solution should achieve? What constraints must any solution adhere to? |
| 3. Determine the solution options you will examine |
Define the scope of your approach to the problem. Identify the possible courses of action that you will examine in your report. You might include the consequences of simply doing nothing. |
| 4. Study how well each option meets the criteria |
Systematically study each option, and compare how well they meet each of the objectives you have set. Provide a systematic and quantifiable way to compare how well to solution options meet the objectives (weighted objectives chart). |
| 5. Draw conclusions based on your analysis | Based on the research presented in your discussion section, sum up your findings and give a comparative evaluation of how well each of the options meets the criteria and addresses the need. |
| 6. Formulate recommendations based on your conclusion | Indicate which course of action the reader should take to address the problem, based on your analysis of the data presented in the report. |
Title Page
The title page of a report should give some basic information: the document’s title, your name, and the date you are delivering (or turning in) the document. Depending on the citation style you choose, there may be additional requirements for the problem primer title page. Additionally, the title page is an opportunity for you to use your document design skills to draw the reader’s attention and interest. You might think about how to incorporate images and fonts to emphasize your message and get the reader engaged before they begin to read. As with other parts of the problem primer, you should consult with your instructor about which elements are required.
Introduction: What is the problem?
The beginning of a report should give a clear idea of both a document’s purpose and its topic. In a professional writing setting, readers often have a limited time to review documents, so it’s best to paint as clear a picture as possible.
To start your report, give the reader a concise description of the problem you hope to solve. The problem statement should clearly discuss what unsatisfactory situation has given rise to this report, and the requirements that must be met in order to solve the problem. Your reader may also need background information to understand why the problem you are examining needs to be solved.
Additionally, your problem primer should give a clear picture of your research questions. Since your report will thoroughly detail your research findings, you will want to make sure that readers have an idea, early in the report, of what questions you set out to answer.
Finally, you should give an overview of the people and communities most affected by the problem you’re investigating – that is, your stakeholders, or the people who will benefit most from a solution. You should give readers a clear understanding of who your stakeholders are, how the problem affects them, and any possible restrictions on the solutions necessitated by stakeholder research. Your writing should reflect an engagement with your stakeholders and an attempt to clearly articulate their needs.
Your introduction should answer the questions:
- What is the problem at hand?
- Why is it important to solve this problem?
- What is the main question your research seeks to address?
- What communities are affected by the problem?
Literature Review
To solve a problem, you must have a clear sense of its causes. In this section, you should use your peer-reviewed research to detail causes that led to the problem. You can use data, studies, and white papers; you want to deliver a clear, well-balanced picture of the problem that considers a variety of viewpoints. Being able to zero in on the causes of a problem lets you have a deep understanding not only of how the problem manifests in the present, but the history of the problem. This gives you a better chance of suggesting solutions that will succeed long-term.
Your literature review should answer the questions:
- According to subject-area experts, what are the various causes of the problems?
- What are key themes in the peer-reviewed research?
- How did you choose the secondary research you reviewed for this project?
Research Design
In the research design section, you should spend time discussing your pilot study. Specifically, this section details the steps you decided to take to answer your research questions. You will discuss which research method you chose, and how you have designed your study to work. This section helps a reader to clearly understand your methods; in turn, presenting a clear picture of your pilot study process can enhance your credibility as a writer.
Your research design section should answer the questions:
- What are the steps you took to answer your question?
- How did you choose your research method (interview, survey, observation)?
- How did your positionality affect your research design choices?
Community-Engaged Research Findings
After you explain your pilot study’s design, you should present its results. Your research findings will help you to show your audience the answers to your research questions. From this point, you can begin thinking about possible solutions to the problem, so it is important that your audience have a clear understanding of what the results say, and how these results will affect future actions.
Your research findings section should answer the questions:
-
- What do community members think about the problem?
- What are community members doing already to address the problem?
Conclusion: Looking Forward
This section, which closes the report, should describe each possible solution so that readers can understand how each one works. Readers will need a sense of the process required by each solution so they can think through the process with you. This section helps readers follow the logic of your analysis so that they can understand the next steps in the problem-solving process. You should also spend some time talking about how the options compare to each other. You should close your report by summing up the relative strengths and weaknesses of each solution; where possible, you should indicate which option you think is the best choice.
Your conclusion should answer the questions:
- Based on your primary and secondary research, what are the various solutions to these problems?
- Which solution(s) responds best to the needs and interests of the community members most impacted by the problem?
References
Finally, your references (or works cited or bibliography) page should list all sources you have used to construct the paper. Specifically, any source you have quoted, summarized, or paraphrased should be included. Consult with your instructor for specific information on how to format this page, how to choose a citation style, and what types of sources to include.
Your references list should:
-
- Match the style (APA, IEEE, Chicago, etc.) you’ve chosen for the document.
- List all sources you have quoted, paraphrased, or summarized.
Designing and Integrating Visuals for Reports[4]
Visual elements such as graphs, charts, tables, photographs, diagrams, and maps capture your readers’ attention and help them to understand your ideas more fully. These visuals help to augment your written ideas and simplify complicated text. They can help the reader understand a complicated process or visualize trends in the data. The key concept to remember is that visuals clarify, illustrate, and augment your written text; they are not a replacement for written text, but using them may help you emphasize your ideas. Visual elements in your document should supplement your written content.
It is important to choose the right kind of visual to convey the story you want your reader to understand. If visuals are poorly chosen or poorly designed for the task, they can confuse the reader and decrease the chance that they understand your message. It is also important to introduce visuals with text so that readers understand what message to take away from the visual. Ideally, visual design and text work together to enhance your document’s message and make it more likely that you will achieve your purpose.
Document Design
Document design refers to the physical characteristics of a document—the size, shape, font, and design of an event poster, for example. In technical communication, the goal is typically to convey information for particular purposes: to explain, to describe, to teach, to persuade, and more. Designing your document effectively ensures that readers understand how to use it. Well-designed documents help readers navigate information, and that is why document design is one of the basic skill sets required of technical writers.
The foremost purpose of any document is to be read. Choosing effective document design enhances the readability of your document so that your document is more likely to achieve its intended purpose. Choose document design elements that make your document user-friendly for the target audience. Keep in mind that people read technical writing because they need to – they need the information. Your job as the document designer is to make their reading process easy, clear, useful and efficient by using all the design tools at your disposal.
For print documents, technical communicators usually focus on page design—text size, font type, color, sections with headers, and the placement of text and images on the page. For online documents, some of the design elements are the same, but there are additional elements to consider, such as navigation bars, headers and footers, search pages, links, and FAQ lists.
The following video from Gregg Learning, “What You Need to Know About Business Document Design,” provides a good introduction to the basic elements of document design:
Visual Design Choices
Visuals can help make abstract concepts concrete for readers; therefore, as a technical communicator, it is vital to know how to use visuals to your advantage. Visuals can work to help readers see what something looks like without having to describe it in writing, such as photos, illustrations, and maps. Visuals can also be effective in representing data, such as quantities or financial information, by using visually-pleasing and easy-to-understand tables, charts, and graphs. Technical communicators also use visual tools, such as flowcharts, Gantt charts, diagrams, and infographics, to help readers understand processes or relationships.
The principles of good technical writing—clarity, conciseness, directness, etc.—are equally important to consider when using visuals. Much of what’s been discussed so far about assessing audience and understanding purpose in writing also applies to using visuals. Clear visuals with appropriate context can help readers focus on key elements of your document. Visuals without appropriate context run the risk of being misunderstood; even the best-looking visual will not help if your reader doesn’t understand what it is or why it is there.
Watch the following video, “Using Graphics in Technical Documents” by Clinton Lanier, for more information on using visuals effectively:
Integrating Visuals in Technical Writing Documents[5]
Graphics can take many forms—tables, charts, photographs, drawings, to name a few—but their purpose rarely varies: they should help to clarify information presented in the report. Graphics can break up a text-heavy report, making the report more visually appealing. They should work together with the text to communicate, rather than replacing the text altogether.
As you begin thinking about possible visuals to include in your document, the first step is to consider which graphics are most appropriate for the message you want to convey. The table below provides some general guidelines on the graphics most suitable to convey specific types of information.
| Information to Convey | Visual Type |
|---|---|
| Numbers, percentages, categories | Tables, charts |
| Processes | Flow charts |
| Geographic data | Maps |
| Chronological or prioritized lists | Numbered lists |
| Non-chronological lists | Bulleted lists |
Integrating Visuals
In general, whenever you integrate any kind of visual into your documents, you should adhere to five key rules.
- Give each visual a numbered caption and title.
- Refer to the caption number within the body text and discuss its content.
- Label all units (x and y axes, legends, column box heads, parts of diagrams, etc.).
- Provide the source of the data and/or visual image if you did not create it yourself.
- Avoid distorting the data or image.
Visual elements should also be surrounded with sufficient passive space (or “white space”) to emphasize the image and enhance its readability. If using someone else’s image, make sure all elements are clear and the print size is readable.
After carefully choosing your visuals, you should work to integrate them strategically into your text. In outlining and planning phases, begin by considering the best or most appropriate locations for your visuals. Some writers find it helpful to note areas where a visual might help readers better understand data, ideas, or a concept; once a draft is complete, the writer can then return to these “markers” to help plan the placement of their visuals. Some technical communicators will create a rough sketch of their visual, while others jot down some basic information about its contents.
Guidelines for Integrating Visuals
The following guidelines will help you effectively integrate, position, and identify your visuals to maintain consistency and uniformity:
- Keep visuals relatively simple: include only the information needed for discussion; remove any unnecessary labels, boxes, and lines.
- Position text horizontally: any explanatory text for the visual should be placed horizontally with adequate white space around the visual.
- Make sure that:
- Units of measurement are specified,
- Relative sizes are clear, and
- Distances are explained or indicated where appropriate.
- Use consistent terminology and formatting for visual documentation: once you choose a format for integrating your visuals into your text, be sure to label them consistently throughout the report, so that readers become familiar with the layout and know what to expect.
Preparing Readers for Graphics
When developing graphics, you will want to consider where they should be placed and what information should surround them. To prepare readers for the information a graphic conveys, also consider these tips:
- Explain or introduce the information/topic of the graphic in the preceding paragraph.
- For easy reference, give each visual a title.
- Make sure the information within the graphic is clear and easy to understand.
- Include a caption or follow-up text after the graphic, such as an interpretation or a final comment about the implications of the visual. If the graphic contains extensive data, you may need to tell your audience what information to focus on.
- Intersperse graphics and text on the same page. Avoid placing graphics on pages by themselves; ideally, no visual should take up more than one-third of a page unless absolutely necessary. If a graphic does not fit on the same page, indicate that it appears on the next page.
- Include identifying details within the graphics such as illustration labels, axis labels, keys, and so on.
Captions and Callouts
Captions and callouts contain information that help readers to interpret graphics. Whereas captions are short phrases or sentences that describe the graphic, callouts (or labels) are used when parts of the image need to be labeled or each part requires a longer explanation. You can learn more about how to use both of these graphics integration options below.
Writing Style for Captions
Captions for graphics should be placed immediately under the graphic; they include the title and any explanatory material. Good captions guide readers not only to see, but also to understand.
The FranklinCovey Style Guide for Business and Technical Communication (5th edition) provides five recommendations for caption writing style.
- Use interpretive captions. Interpretive captions provide a title and explanatory information to help readers understand the message that the writer wants to convey. Example: “Figure 23-Check Valve. The risk of bad air entering the changer is near zero because the check valve permits air flow in one direction only.” The caption states clearly what the writer wants the reader to learn from the drawing.
- Avoid short or ambiguous titles. Make sure that you give each image a title that provides information to the reader. Specifically, you want your reader to be able to understand the purpose of the image through the title and caption.
- Number figures and tables. Use the word “Figure” or “Table,” and start with number 1. Place the number before the caption. Example: “Figure 1-caption.”
- Place captions thoughtfully. Captions can appear above or below a visual, but consistency throughout the document is critical. Choose one, know the rational for your choice, and make sure that all images are captioned in the same way.
Guidelines for Callouts
Callouts are labels placed on a graphic that help a reader to understand the parts of the image.
Here are a few guidelines for writing successful callouts:
- Determine the number of items to identify in the image. Depending on the complexity of the image, you may have a lot of callouts to place. Think carefully about how many callouts to use, and balance that with your understanding of your reader’s knowledge level and the purpose of your image.
- Use the same terms on the callout as in the text. Remember that, even if you use callouts, you need to explain the image to your readers. If you call a part a “safety valve” in the callout, make sure you also call it a safety valve in your text. This helps the reader make the appropriate connections between the image and the text.
- Use a standard font and size for readability. Even if you have a lot of callouts to place, you should make sure that the font is large enough and clear enough that readers can clearly see the text.
- Place callouts next to the elements in the graphic they identify, using a line to connect the two, if necessary. Make sure that your readers can understand exactly which part of the image your callout is meant to identify. This can be especially important in highly technical drawings or diagrams.
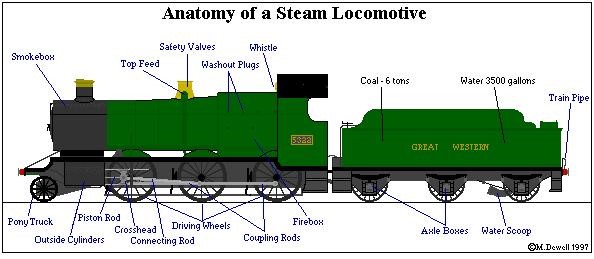
The following graphic (Figure 10.1) adopts a consistent visual style in the way that it identifies the parts of a locomotive (a relatively complex machine). Labels are placed directly next to the graphic, connected by lines. The title is placed above rather than below the visual for easy differentiation from the callouts.
Conclusion
This chapter should give you a clear sense of how to create a report that thinks carefully about audience, purpose, and context. Being able to tailor researched information for such audiences is a skill that will serve you well, both during your time in college and once you join a workplace. Thinking about how to utilize research is a common technical communication problem, so practicing now will give you an opportunity to understand the process of problem-solving in the field.
Once you have completed your problem primer, you and your groupmates will reconvene, share your research, and decide how to move forward on a collaborative grant proposal.
References
“Basic Information about Lead in Drinking Water.” (2025). EPA.gov. Retrieved 3 July 2025, from https://www.epa.gov/ground-water-and-drinking-water/basic-information-about-lead-drinking-water.
Bursi-Amba, Armelle, Aline, Ea, Romain Gaullier, and Manoela Santdiran. (2016). Infographics: A tool for technical writers? UFR d’etude interculturelle de langues appliquees. Retrieved 16 July 2025, from https://uark.pressbooks.pub/app/uploads/sites/99/2020/05/Infographic-Article.pdf.
Covey, Stephen R. (2012). FranklinCovey Style Guide: For Business and Technical Communication (5th Edition). Pearson FT Press.
GreggU. (2015). “What You Need to Know about Business Document Design.” YouTube. Retrieved 5 July 2025, from https://www.youtube.com/watch?v=JFU6or8MAKA.
Lanier, Clinton. (2016). “Using Graphics in Technical Documents.” YouTube. Retrieved 5 July 2025, from https://www.youtube.com/watch?v=O8jDA88ZLqU.
Perelman, Leslie C., Edward Barrett, and James Paradis. (YR). Timetables (Gantt charts). In Mayfield electronic handbook of technical and scientific writing. Retrieved 16 July 2025, from https://web.mit.edu/course/21/21.guide/grf-ttab.htm.
“Synthesizing Sources.” (n.d.). Center for Scholarly Communication, Indiana University of Pennsylvania. Retrieved 3 July 2025, from https://www.iup.edu/scholarlycommunication/our-writing-resources/synthesizing-sources.html.
“Writing a Research Paper: Synthesizing Sources.” (2025). MacPháidín Library, Stonehill College. Retrieved 3 July 2025, from https://libguides.stonehill.edu/writing_a_research_paper/synthesis.
- Please note: these sources and themes are fictionalized. ↵
- Based on Will Fleming's "Chapter 6: Research and Information Literacy," in Technical Writing at LBCC. ↵
- Based on Will Fleming's "Chapter 7: Technical Reports," in Technical Writing at LBCC. ↵
- Based on Will Fleming's "Chapter 3: Design and Visuals," in Technical Writing at LBCC ↵
- Based on Will Fleming "Chapter 3: Design and Visuals," in Technical Writing at LBCC and Katrina Peterson's "Chapter 5: Document Design," in Technical and Professional Writing Genres: A Study in Theory and Practice ↵
