Design Drivers – What is a “Good” solution in the Product Design Context
Good Enough
One of the key challenges in product design is how to make optimal decisions that balance the needs and preferences of the users, the constraints and resources of the project, and the goals and vision of the stakeholders. However, finding the optimal solution is often impossible or impractical, as it would require exploring all possible alternatives and evaluating them against multiple criteria. This is where the concept of satisficing comes in handy. Satisficing is a term coined by the economist and Nobel laureate Herbert Simon, who argued that human decision makers often settle for satisfactory solutions rather than optimal ones, due to their limited information, time, and cognitive abilities. In product design, satisficing means choosing a design option that meets a minimum level of acceptability or adequacy, rather than searching for the best possible option. Satisficing can help designers avoid analysis paralysis, reduce uncertainty and risk, and speed up the design process. However, satisficing also has some drawbacks, such as missing out on potentially better solutions, compromising on quality or innovation, and settling for suboptimal outcomes. Therefore, satisficing should be used with caution and judgment, and not as an excuse for laziness or mediocrity.
There are three high-level categories of satisficing for product design: Project Cost, Product Quality features, and Time to Market. These categories represent the main factors that influence the design decisions and outcomes of a product development process.
Project Cost
The project cost for product design is composed of different parts, such as design, manufacturing, testing, marketing, and distribution. Each of these parts has a significant impact on the success of a design project, as they affect the quality, functionality, usability, and appeal of the product. However, among these parts, design is the most influential and critical one. Design decisions themselves have very little cost compared to other parts of the project, but they determine the requirements and specifications for the rest of the project. For example, a design decision about the shape, size, or material of a product can affect the manufacturing process, the testing methods, the marketing strategy, and the distribution channels.
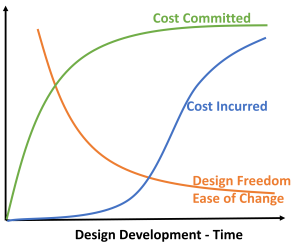
Cost committed and cost incurred are two important concepts in the design and manufacturing process. Cost committed refers to the amount of money that is allocated or obligated for a project or activity, regardless of whether it has been spent or not. Cost incurred refers to the actual expenditure of money for a project or activity, which may be less than or equal to the cost committed.
The difference between cost committed and cost incurred can have significant implications for the design and manufacturing process. For example, Figure # shows the relationship between cost committed and cost incurred over the different stages of the design and manufacturing process, from conceptual design to production. The figure shows that the majority of the cost of manufacturing is already committed at the end of the conceptual design stage, even though the actual cost incurred is still low. This means that any changes or modifications made after the conceptual design stage will have a limited impact on reducing the cost of manufacturing but may increase the cost incurred due to rework or delays. Therefore, it is important to make optimal decisions and trade-offs during the conceptual design stage, when the cost committed is still low and flexible, and avoid unnecessary changes or errors in later stages, when the cost committed is high and fixed.
Project Quality Features
A product affords a capability to a particular level of performance for a period of time. These three things (capability, level of performance, and time period) can all be summarized as feature qualities. For example, a consumer might compare two vehicles based on safety. They might look at rollover resistance (a capability and a performance level) as well as a perceived reliability (how long it should continue to provide that performance. When designing a product there are design decisions that affect the quality of the features in the product. Further, the law of diminishing returns affects these choices. A cell phone that offers 1 terabyte of storage is not much different than a phone that offers 100 terabytes as both are week beyond what the typical consumer needs. The satisfactory quality of different features are not equal, that is, designers do not try and optimize every feature.
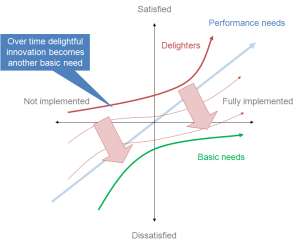
The Kano model is a framework for prioritizing features of a product based on the level of customer satisfaction they can bring. The Kano model was introduced by Noriaki Kano, a quality management professor at the Tokyo University of Science, in 1984. According to the Kano model, there are three types of features: basic, performance, and attractive. Basic features are the ones that customers expect and take for granted, such as the brakes of a car. They do not increase satisfaction if present, but they cause dissatisfaction if absent. Performance features are the ones that customers are aware of and can compare with competitors, such as the speed of a car. They increase satisfaction if present and decrease satisfaction if absent. Attractive features are the ones that customers do not expect and are pleasantly surprised by, such as a sunroof of a car. They increase satisfaction if present, but do not cause dissatisfaction if absent. The Kano model helps product managers and designers identify the optimal mix of features that can satisfy and delight customers while being feasible to implement.
Time to Market
Time to market (TTM) is the measure of how long it takes your product team to usher an idea from inception to full public release. It gives you a way to conceptualize the amount of time required to complete various tasks throughout product development. In a competitive and fast-changing market, reducing TTM can provide significant advantages for your product, such as gaining a competitive edge, early revenue generation, and maximizing product lifecycle.
The performance evolution of a product over time can often be described by an S-curve, which shows how the product evolves from its introduction to its maturity and decline. One example of a product that follows an S-curve is the lightbulb. The lightbulb was invented in the late 19th century and improved gradually over time, reaching its peak performance in the mid-20th century. The lightbulb’s performance is measured by its efficiency, which is the ratio of light output to power input. The efficiency of a lightbulb depends on the type of filament, the gas inside the bulb, and the shape and size of the bulb. New innovations drive the improvement in efficiency.
The S-curve of the lightbulb’s efficiency shows that in the early stages, the rate of progress was slow, as inventors experimented with different materials and designs. As the technology became more mature, the rate of progress increased, as engineers optimized the existing solutions and discovered new ones. However, as the technology approached its physical limits, the rate of progress slowed down again, as further improvements became more difficult and costly. Without introduction of a completely new technology that utilizes different underlying physics (such as LEDs), the performance tends to follow this curve.
Depending on the maturity of a product, the time to market constraints differ. For a new type of product, the time to market constraints are longer, as it requires more research and development, testing, and validation. Being the first to enter the market is important, but only if the functionality is adequality implemented. Legal protections such as patents help provide companies time to develop new technology products.
For a mature product based on well-established technology, the time to market is shorter, as it relies on incremental innovations and adaptations. Taking a long time to make an incremental improvement will often result in losing out on market share as others will have provided that improvement (or comparative performance) earlier.
See the following article from Jason Crawford on how to understand innovation using the S-curve model.
These three categories (Cost, Quality of Features, and Time to Market) define and constrain most of the product design decisions. Further, they interact with each other. Spending more time to make improvements in quality increases cost and obviously extends the time to market. Shorter time to market goals may lead to selecting more costly manufacturing choices, thus reducing the value of more market share. Therefore, we define a “good design” as one which satisfies our cost, quality and time frame constraints.
