11 Myocardial Ischemia and Infarction
Recognizing the EKG patterns associated with myocardial ischemia and infarction is a critical skill for healthcare professionals. These conditions, which result from inadequate blood supply to the myocardium, can have significant clinical implications and often require urgent intervention. Remember, while findings on the EKG are crucial, they should always be interpreted in the context of the patient’s clinical presentation and other diagnostic information. By the end of this chapter, you will have a solid foundation for recognizing these important EKG patterns, enabling you to contribute effectively to the rapid diagnosis and management of patients experiencing suspected myocardial ischemia or infarction.
Myocardial Ischemia
The heart, like any other muscle in the body, requires a constant supply of oxygen-rich blood to function properly. When this supply is compromised a condition known as myocardial ischemia can occur. This reduction in blood flow to the cardiac muscle can result from various factors, most commonly atherosclerosis, where plaque buildup narrows the coronary arteries. During physical exertion or emotional stress, the oxygen demand of the heart increases. In patients with underlying coronary artery disease, this increased demand may not be met due to restricted blood flow, leading to ischemia.
When interpreting an EKG for signs of ischemia, particularly in the context of exercise, key features to watch for include ST depression, T wave inversions, and in some cases, ST elevation. Changes in R wave progression in the precordial leads can also be indicative of ischemia. It is important to examine these patterns across multiple contiguous leads (e.g., anterior leads, lateral leads), as ischemic changes often appear in anatomically neighboring areas corresponding to specific coronary artery regions of the heart. Myocardial ischemia is indicated when two or more anatomically contiguous leads meet the criteria for ST depression. These EKG changes can be subtle and dynamic, evolving over time as ischemia progresses or resolves, making careful and repeated analysis essential.
Myocardial Infarction
When blood supply to an area of the heart is severely reduced or completely blocked, the affected cardiac muscle can suffer irreversible damage, a condition commonly known as a heart attack. This interruption in oxygen-rich blood flow is often due to a complete blockage of a coronary artery by a blood clot, typically formed from a plaque rupture. The resulting damage to the myocardium is termed myocardial infarction (MI).
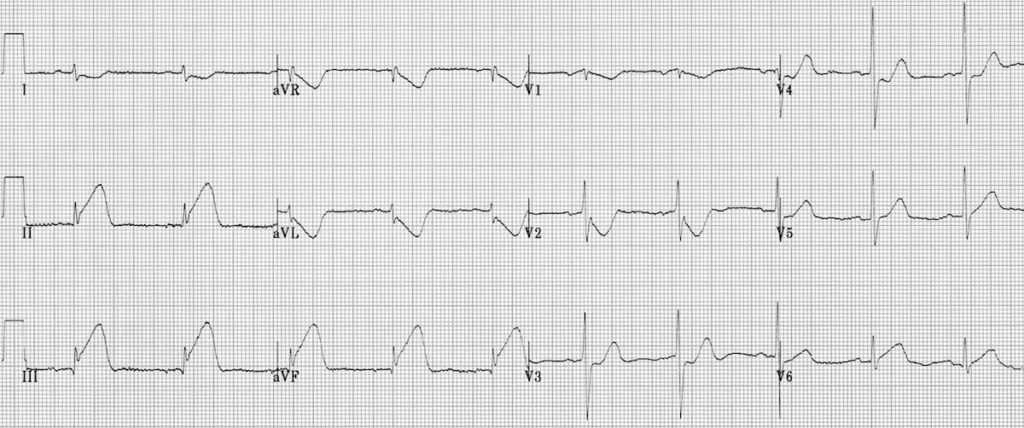
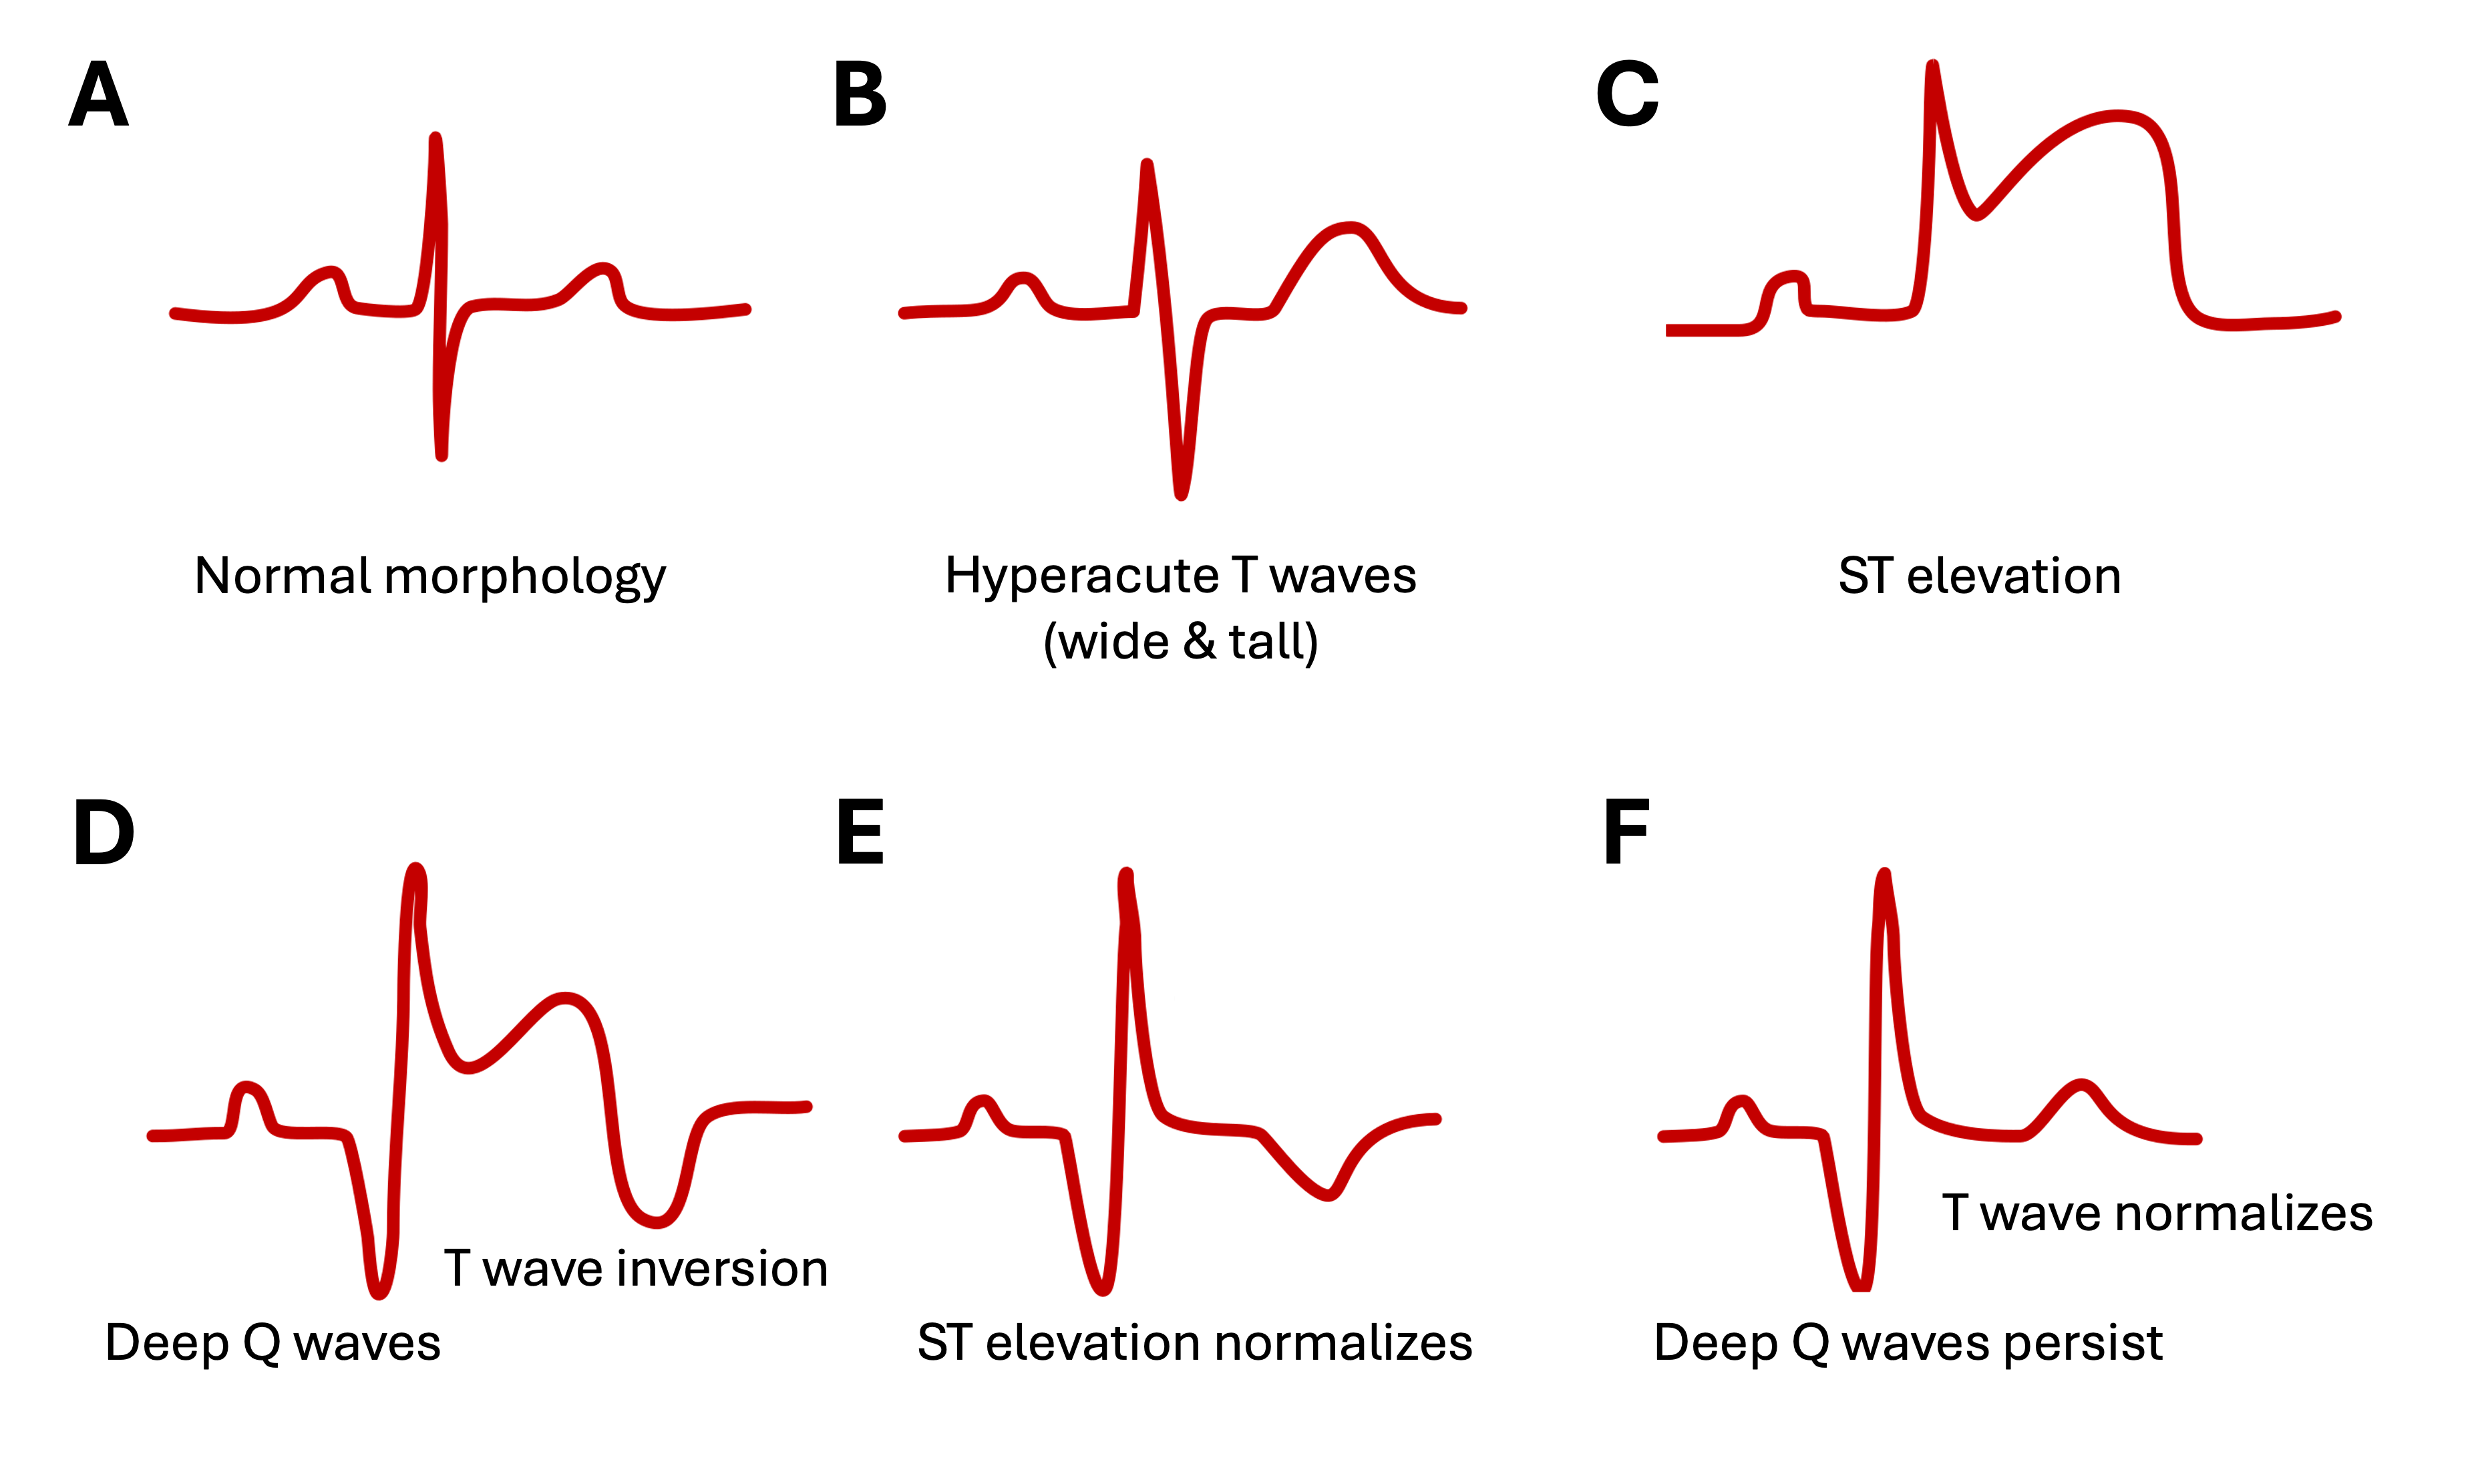
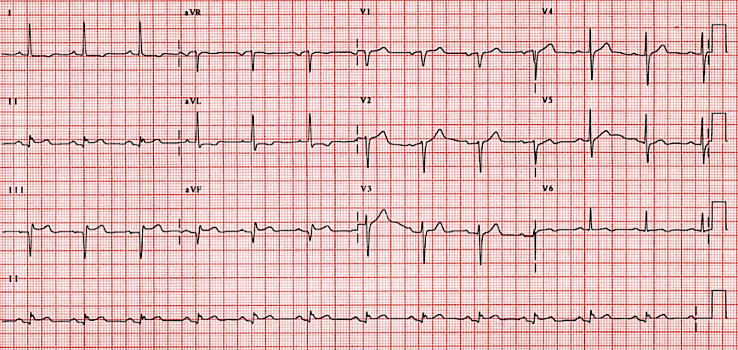
On the EKG, MI can present with several characteristic changes. Assess for ST elevation in two or more contiguous leads, which is a trademark of an acute MI. In other words, if ST elevation is found in one of the lateral leads, say V5, then it is important to look for ST elevation in the other lateral leads to confirm suspicion of acute MI. When two or more instances of ST elevation are present, myocardial infarction is indicated. Pathological Q waves, which are deeper and wider than normal Q waves, may develop as the infarction progresses, which is an indication of necrotizing cardiac tissue. Inversion of the T wave can also be seen, especially in the leads corresponding to the affected area of the heart, but do not always present. Additionally, reciprocal ST segment depression in leads opposite to those with ST elevation can further support the diagnosis (Figure 11.1). We will delve deeper into the steps necessary for recognizing these changes in this chapter.
Interpretation of Myocardial Ischemia and Infarction
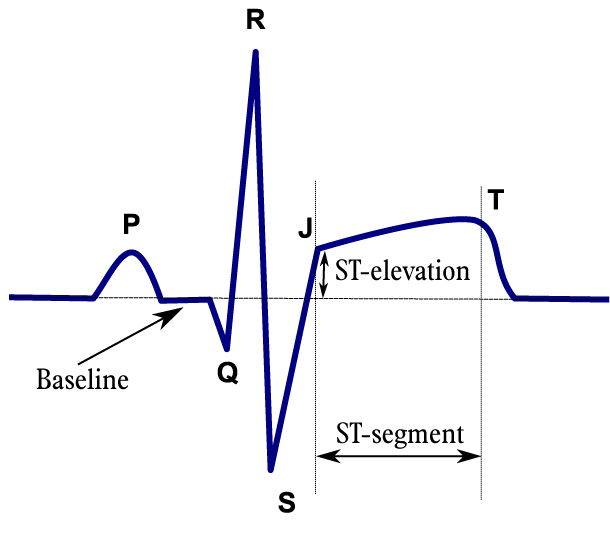
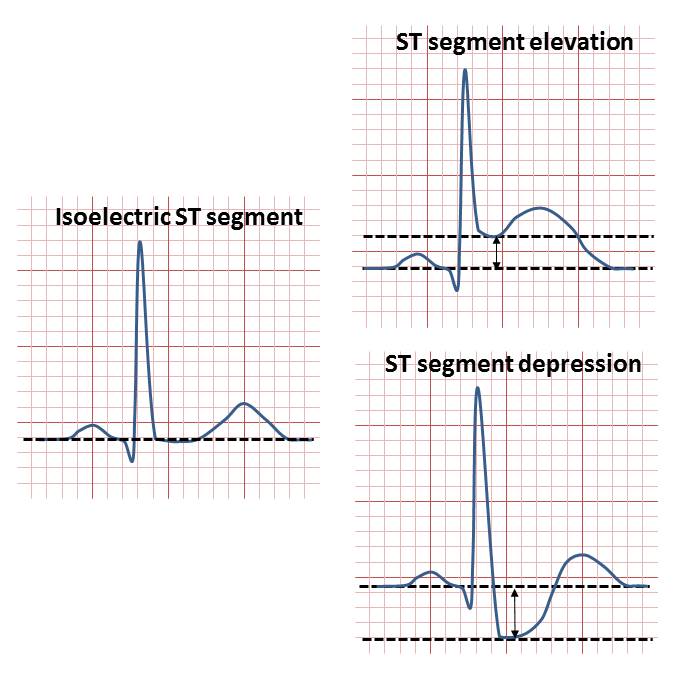
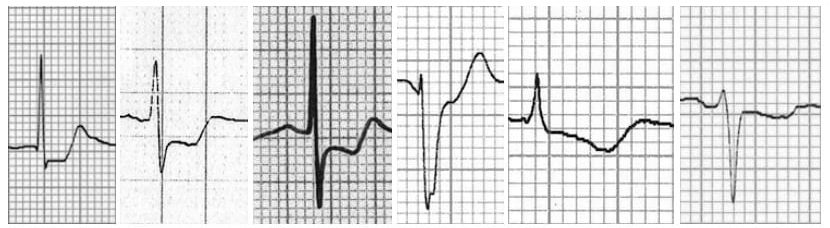
The ST segment represents a critical phase in the cardiac cycle, occurring between ventricular depolarization (i.e., QRS complex) and repolarization (i.e., T wave). Physiologically, it corresponds to the plateau phase of the cardiac action potential, when ventricular cells are in a relatively stable state. Clinically, the ST segment is crucial for identifying myocardial ischemia and MI. ST elevation or depression can indicate insufficient oxygen-rich blood supply to the myocardium. ST elevation in specific patterns may signal a ST elevation MI (STEMI), requiring urgent intervention. However, interpretation requires caution. Some ST changes, like early repolarization in young adults, can be normal variants. The J point, where the QRS complex ends and the ST segment begins, is the reference point for measuring ST deviation.
Interpreting ST segment changes should always be done in conjunction with the clinical presentation and other EKG findings. This segment, though brief, provides valuable insights into cardiac health and can guide critical treatment decisions. Understanding the context of ST changes, such as symptoms of chest pain or risk factors for coronary artery disease, enhances the accuracy of your assessment and helps determine the appropriate course of action.
ST Segment Depression
When analyzing ST depression on the EKG, we can focus on the following key points:
- Look for ST segment depression ≥0.5 mm in two or more contiguous leads, measured at the J point
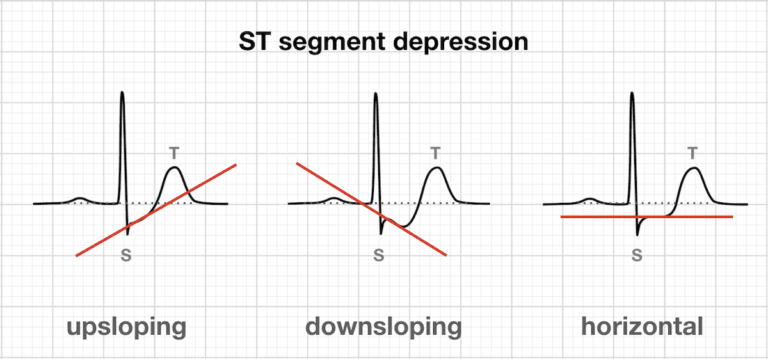
- Assess the morphology of the depression; horizontal or downsloping ST segments are more suggestive of ischemia than upsloping ST depression
- Examine the distribution of ST depression across other groups of leads, as this can help localize the affected area
- Remember that ST depression can be reciprocal to ST elevation in opposite leads and can also occur in non-ischemic conditions such as left ventricular hypertrophy, bundle branch blocks, or electrolyte imbalances
ST Segment Elevation
For ST elevation, the following key aspects can be considered:
- Look for ST elevation ≥1.0 mm in two or more contiguous leads, measured at the J point
- In leads V2 and V3, the thresholds are higher:
- ≥2.0 mm in men age 40 or older
- ≥2.5 mm in men younger than 40 years
- ≥1.5 mm in women of all ages
- Evaluate the morphology of the ST elevation; convex (or dome-shaped) ST elevation is more concerning for acute MI than concave (or saddleback) ST elevation
T wave
- Hyperacute T waves are the first ischemic changes in a STEMI, characterized by the following:
- Morphology
- Broad, tall and symmetric peaked T waves
- Wide base and rounded peak, looks “inflated’ or “swollen” compared to normal T waves
- Amplitude
- Large relative to the size of the QRS complex. Recent research suggests that raw T wave amplitude alone does not correlate well with MI diagnosis[1]
- Hyperacute T wave amplitude often exceeds 50% of R wave amplitude in same lead
- Associated findings
- May be accompanied by subtle ST elevation or depression
- May see loss of R wave amplitude or development of Q waves
- Reciprocal ST/T changes in opposite leads
- Morphology
- T wave inversion occurs in stages following hyperacute T waves and ST elevation
- Usually hours to days after onset of infarction, signifying ongoing injury and ischemia
- Often seen in the leads correlates to the affected area of infarct and can persist for days to weeks
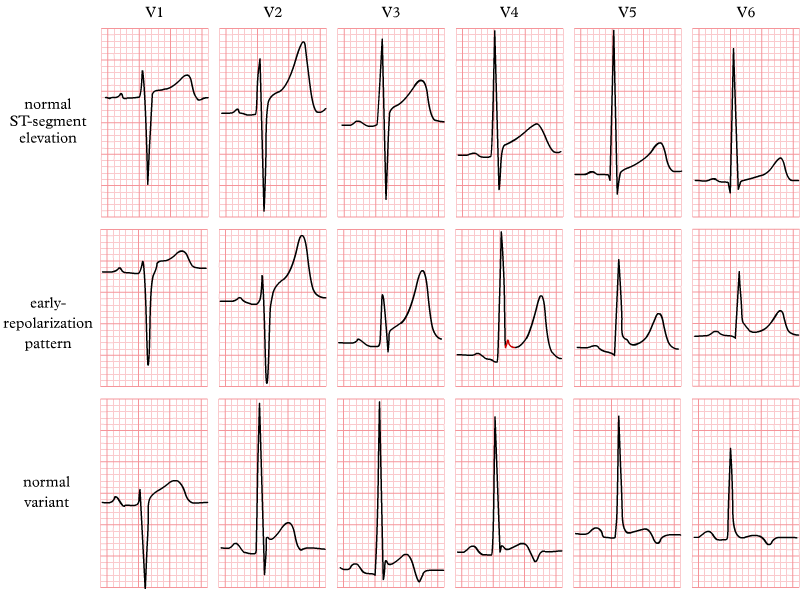
Benign Early Repolarization
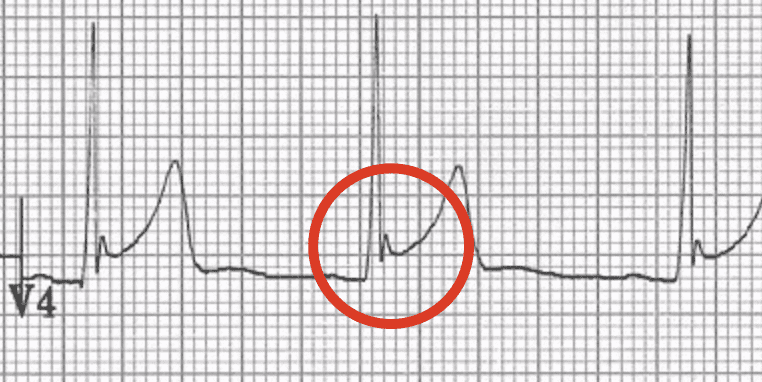
A common EKG finding in young, healthy adults and athletes is benign early repolarization (BER). It is characterized benign early repolarization by ST elevation, typically in the precordial leads (V2-V5), with a distinctive concave upward (“smiley face”) shape. Key features include J point elevation of ≥1 mm in two or more contiguous leads, notching or slurring of the terminal QRS complex (J waves), and tall, symmetrical T waves. It is generally considered a normal variant, but it is important to differentiate BER from more serious conditions like acute MI. The ST elevation found in BER is usually widespread, does not evolve over time, and is not associated with reciprocal ST depression (except in aVR). Refrain from diagnosing BER in patients over the age of 50, particularly if risk factors for ischemia heart disease are present.[2]
Typical Stages of Acute MI
Types of Myocardial Ischemia and Infarction
Subendocardial Ischemia
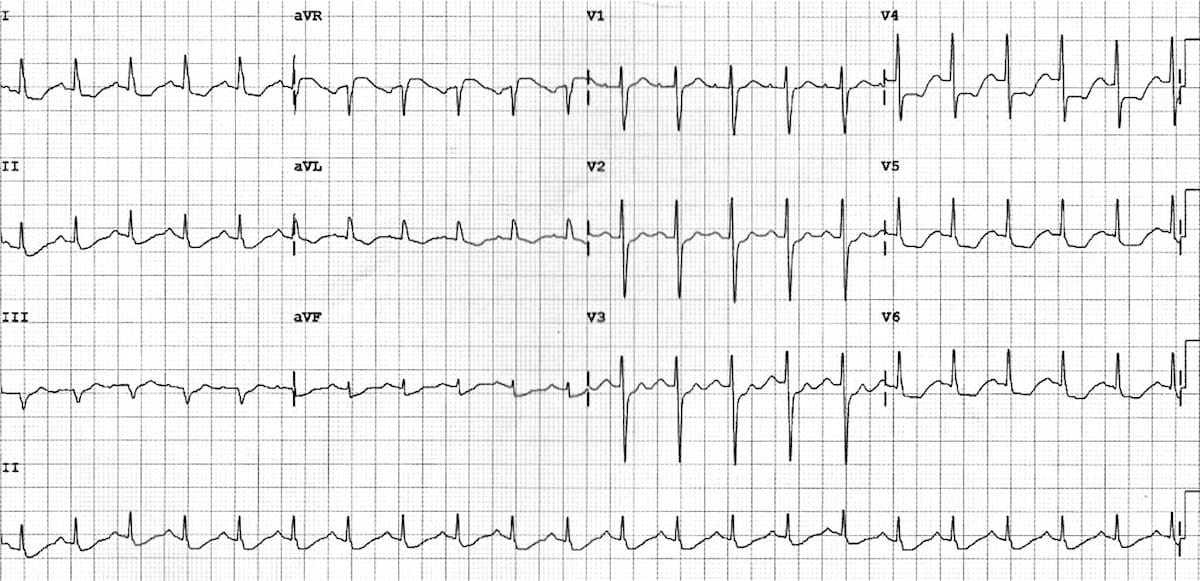
When the innermost layer of the myocardium experiences reduced blood flow, subendocardial ischemia occurs. It is often a reversible condition, particularly when it occurs due to temporary imbalances between myocardial oxygen supply and demand. It is commonly observed during physical exertion or exercise stress tests, where the increased workload of the heart may temporarily outpace the oxygen supply to the inner layers of the myocardium. Once the elevated cardiac workload ceases or the underlying cause is addressed, the EKG changes typically resolve, highlighting the importance of recognizing this pattern in both clinical and diagnostic settings. Subendocardial ischemia typically presents with the following EKG characteristics:
- ST depression
- Variable ST depression morphology (i.e., horizontal, downsloping) can be seen in multiple leads but does not localize to a specific coronary artery region
- Lead distribution
- Usually widespread, often seen in leads I, II, V4 – V6. If widespread and ST elevation in aVR >1 mm is present, indicates occlusion of left main coronary artery
- T wave changes
- T waves may become flattened or inverted and often accompany ST depression to indicate ongoing ischemia, but changes are not always present
- Characteristics of inverted T waves indicative of ischemia:
- ≥1 mm deep
- Present in ≥2 contiguous leads with dominant (or upright) R waves
- Characteristics of inverted T waves indicative of ischemia:
- T waves may become flattened or inverted and often accompany ST depression to indicate ongoing ischemia, but changes are not always present
- Reciprocal changes
- Absent or, in some cases, subtle ST elevation in lead aVR and sometimes in V1 and V2. This pattern may suggest left main coronary artery disease
- Duration
- Changes may be transient, resolving with the relief of ischemia
In subendocardial ischemia, ST depression on the EKG does not pinpoint the ischemia to a specific area of the heart based on contiguous leads. Unlike ST elevation, which can localize the event to a particular coronary artery territory (e.g., anterior, lateral, inferior), ST depression tends to appear more diffusely or generalized rather than a focal point.
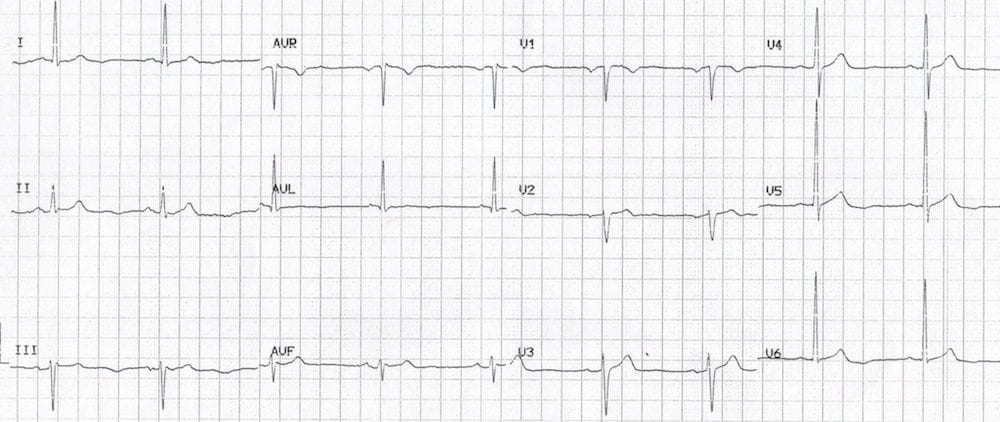
Subendocardial Infarction
When there is actual damage to the inner layer of the myocardium due to inadequate coronary artery blood flow, subendocardial infarction, also known as non-ST elevation myocardial infarction (NSTEMI) occurs. This condition can develop at rest in patients with severe coronary artery disease, where even resting myocardial oxygen demand exceeds supply. During exercise or stress, the risk of subendocardial infarction increases as the cardiac workload and oxygen demand rise, potentially outpacing the limited blood supply in patients with coronary artery disease. The subendocardium is particularly vulnerable due to its position being furthest from the epicardial coronary arteries and its exposure to higher wall tension, making it often the first area to suffer in situations of reduced coronary perfusion, such as MI. Characteristic EKG findings for subendocardial infarction include:
- ST depression
- More pronounced and persistent ST depression in multiple leads
- Q waves
- Often absent, but small Q waves may develop in affected leads
- T wave inversion
- Deep, symmetric T wave inversions in affected leads
- Inverted U waves
- Flipped U waves are abnormal in leads with upright T waves and a specific sign for presence of ischemia
- In patients presenting with angina, inverted U waves may be earliest sign of evolving MI
- Flipped U waves are abnormal in leads with upright T waves and a specific sign for presence of ischemia
- Lead distribution
- Similar to subendocardial ischemia, but changes are more widespread on the EKG
- Reciprocal changes
- Absent or minimal ST elevation in other leads
- Duration
- Changes persist longer and may become permanent
Transmural Infarction
When there is a significant reduction in coronary blood flow across the entire thickness of the heart, from the endocardium to the epicardium, transmural infarction occurs. This type of MI is often more severe and can lead to extensive myocardial damage if not promptly addressed. On the EKG, transmural infarct is typically characterized by the following changes:
- ST elevation
- ≥1 mm ST elevation in ≥2 contiguous leads
- Reciprocal changes
- ST depression in leads opposite to those with ST elevation
- T wave changes
- Hyperacute T waves initially, followed by T wave inversion
- Q waves
- Pathological Q waves may develop, indicating irreversible damage
- Persistence
- Changes are more persistent than ischemia and may become permanent on the EKG
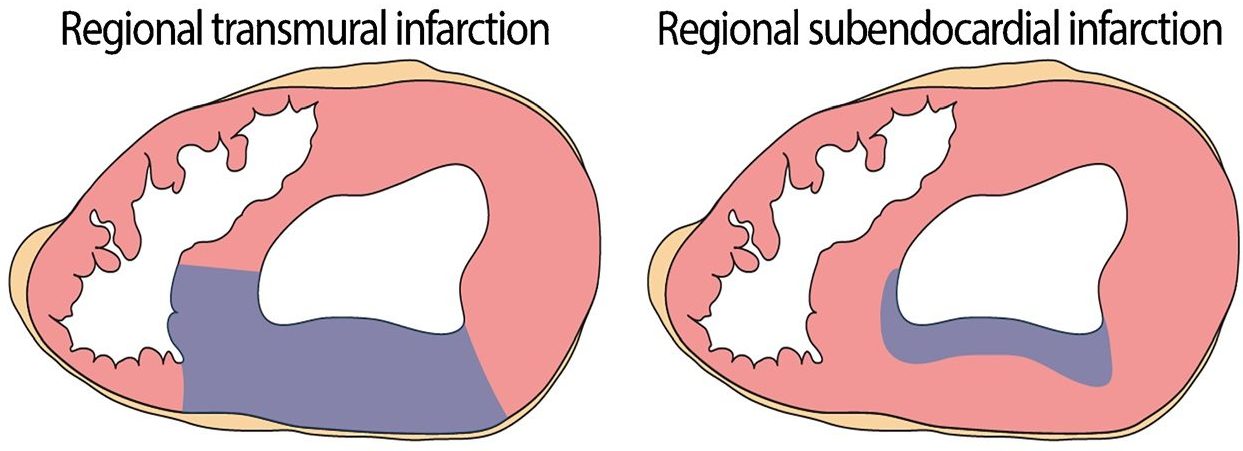
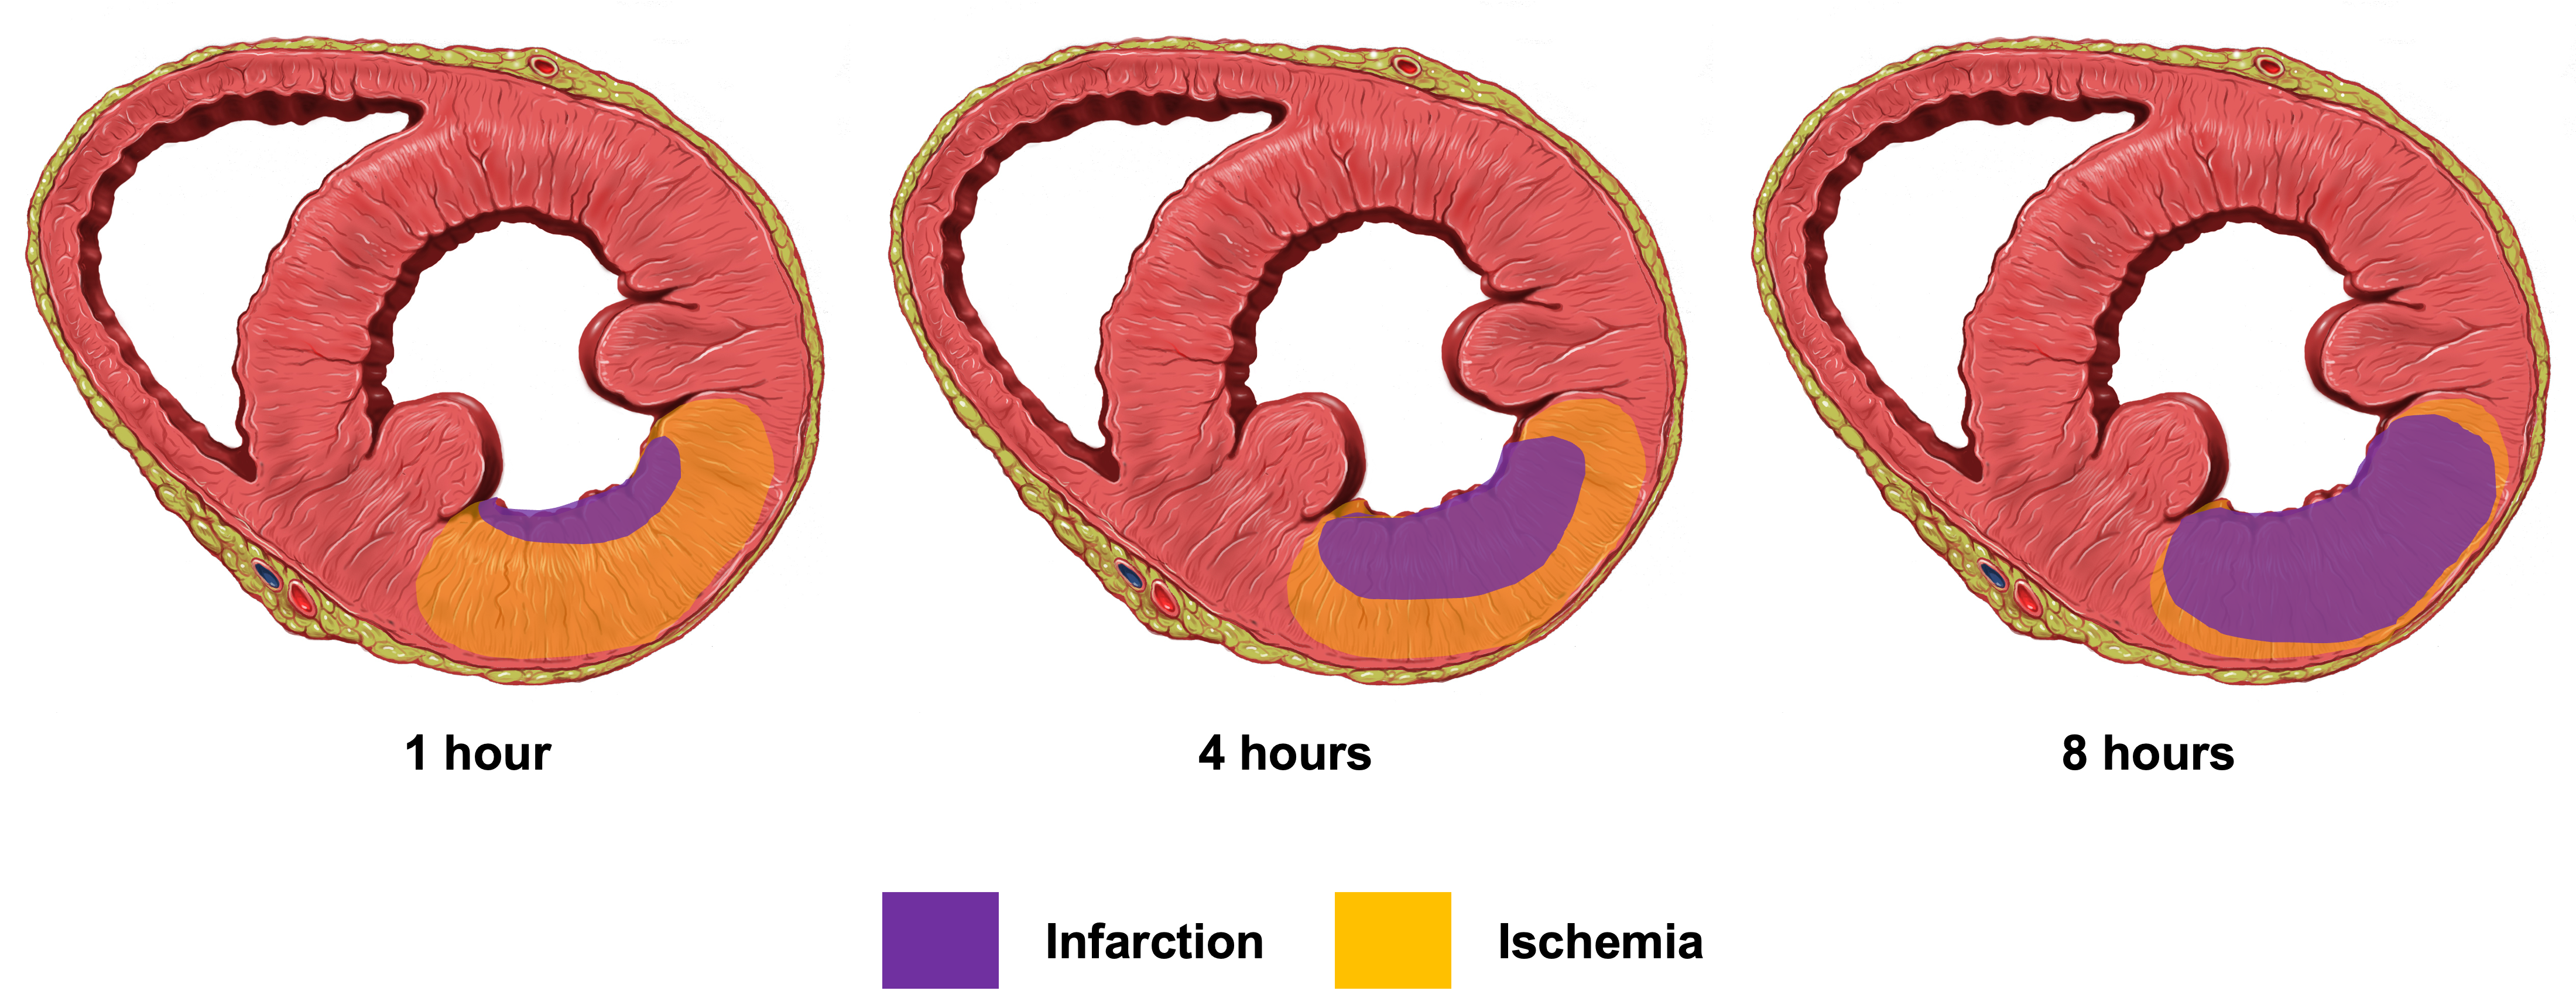
Image Attributions:
Fig. 11.1 – “ECG Inferior AMI STEMI Hyperacute” by Ed Burns and Robert Buttner, is licensed under CC BY-NC-SA 4.0
Fig. 11.2 – “Stelevatie en” by Rob Kreuger, is licensed under CC BY-NC-SA 4.0 / Cropped from original
Fig. 11.3 – “ST segment elevation and depression” by PeaBrainC, is licensed under CC BY-SA 4.0
Fig. 11.4 – “ST segment depression upsloping downsloping horizontal” by Ed Burns and Mike Cadogan, is licensed under CC BY-NC-SA 4.0
Fig. 11.5 – “ST segment morphology in myocardial ischemia” by Ed Burns and Mike Cadogan, is licensed under CC BY-NC-SA 4.0
Fig. 11.6 – “Normal ST elevation” by ECGpedia, is licensed under CC BY-NC-SA 3.0 / Cropped from original
Fig. 11.7 – “ECG Fish-hook pattern BER” by Ed Burns and Mike Cadogan, is licensed under CC BY-NC-SA 4.0
Fig. 11.8 – “Evol of MI” by Oldblueday, is licensed under CC BY-SA 4.0 / Labelled and retitled each section
Fig. 11.9 – “Screenshot-2020-05-29-09.24.45.png” by Simon Carley, is licensed under CC BY-NC-SA 4.0
Fig. 11.10 – “Subendocardial ischemia––ECG-Left-main-coronary-artery-LMCA-1” by Robert Buttner and Emre Aslanger, is licensed under CC BY-NC-SA 4.0
Fig. 11.11 – “ECG-lateral-U-wave-inversion-Something-Sinister.jpg” by Ed Burns and Robert Buttner, is licensed under CC BY-NC-SA 4.0
Fig. 11.12 – “Patterns of topographic distribution of myocardial infarction” by Michaud et al. is licensed under CC BY 4.0 / Cropped from original
Fig. 11.13 – This work, “Progression of myocardial damage from infarction”, is adapted from “Heart normal short axis section” by Patrick J. Lynch, used under CC BY 2.5. “Progression of myocardial damage from infarction” is licensed under CC BY-NC 4.0 by Dr. Joshua E. McGee
- Smith SW. Hyperacute T-waves Can Be a Useful Sign of Occlusion Myocardial Infarction if Appropriately Defined. Ann Emerg Med. 2023 Mar 3. doi: 10.1016/j.annemergmed.2023.01.011. ↵
- Alemzadeh-Ansari, M. J. (2022). Electrocardiography. In M. Maleki, A. Alizadehasl, & M. Haghjoo (Eds.), Practical Cardiology (Second Edition)(pp. 17–59). Elsevier. https://doi.org/10.1016/B978-0-323-80915-3.00005-3 ↵
A condition characterized by insufficient blood flow to a tissue, leading to a shortage of oxygen and nutrients necessary for cellular function.
a disease characterized by the buildup of fatty plaques in the walls of arteries, leading to their hardening and narrowing, which can restrict blood flow and increase the risk of cardiovascular events (e.g., stroke, myocardial infarction, cardiovascular death).
A normal variant on an EKG characterized by elevated J point and ST elevation, typically seen in healthy individuals without underlying heart disease.
A type of heart attack characterized by partial blockage of a coronary artery, resulting in myocardial ischemia and injury without the hallmark ST segment elevation seen on an EKG.
