10 Atrial Enlargement and Ventricular Hypertrophy
The heart’s ability to adapt to chronic stress often results in structural remodeling, most notably atrial enlargement and ventricular hypertrophy. These alterations, while initially compensatory, can lead to significant cardiac dysfunction if left unchecked. The 12-lead EKG serves as a valuable tool in detecting and characterizing these structural changes, offering clinicians important insights into a patient’s cardiac status. This chapter will explore the EKG manifestations of atrial enlargement and ventricular hypertrophy, providing a systematic approach to recognizing these conditions.
Pathophysiology of Atrial Enlargement
Atrial enlargement occurs as a result of chronic hemodynamic stress on the atrial chambers. This stress can be due to increased pressure or volume load, leading to structural and electrical remodeling of the atrial myocardium. In left atrial enlargement (LAE), common causes include mitral valve disease, left ventricular dysfunction, and hypertension, which increase left atrial pressure and impair its capabilities of emptying. Right atrial enlargement (RAE) often results from conditions that elevate right-sided pressures, such as pulmonary hypertension, tricuspid valve disease, or right ventricular dysfunction. The enlarged atria become more susceptible to thromboembolic events and arrhythmias, particularly atrial fibrillation, due to altered conduction properties and increased fibrosis. Over time, atrial enlargement can lead to further deterioration of cardiac function, contributing to a cycle of progressive cardiac remodeling and dysfunction.
Interpretation of Atrial Enlargement
The electrical signature of a growing heart chamber can be subtly revealed through careful examination of the EKG. When the atria grow beyond their normal dimensions, they leave telltale signs in the form of altered P wave characteristics, as the P wave represents atrial depolarization. These changes in the P wave morphology, duration, and amplitude can vary depending on whether the left or right atrium is affected. Generally, an enlarged atrium produces a larger, wider, or more notched P wave compared to normal. However, the specific criteria for LAE and RAE differ, and it is crucial to understand these distinctions for accurate interpretation. By focusing on the nuances of P wave appearances with a keen eye and a systematic approach across different leads, health professionals can uncover valuable information about the heart’s structure and function, which can then guide further diagnostic and therapeutic decisions.
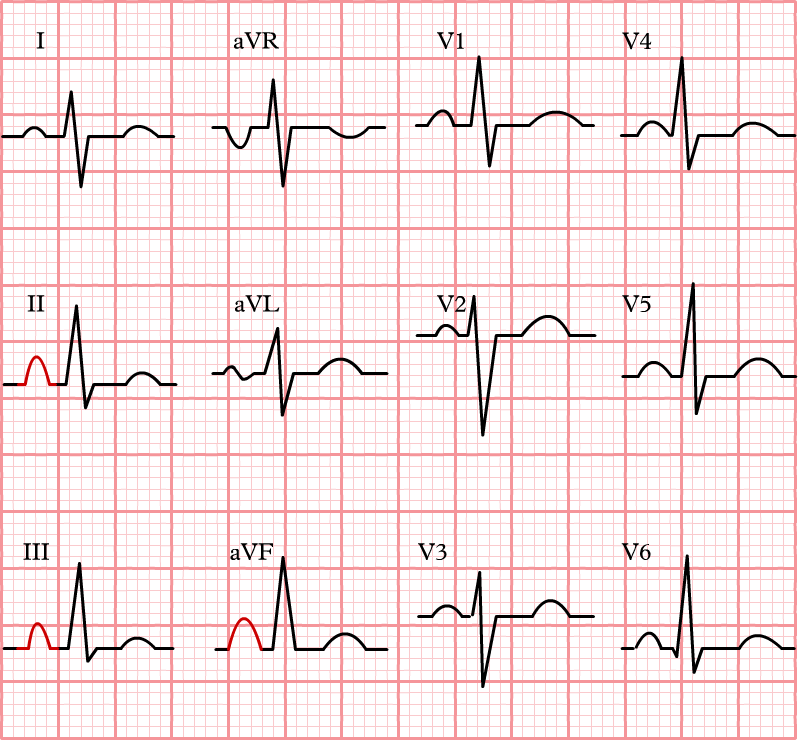
1. Left Atrial Enlargement
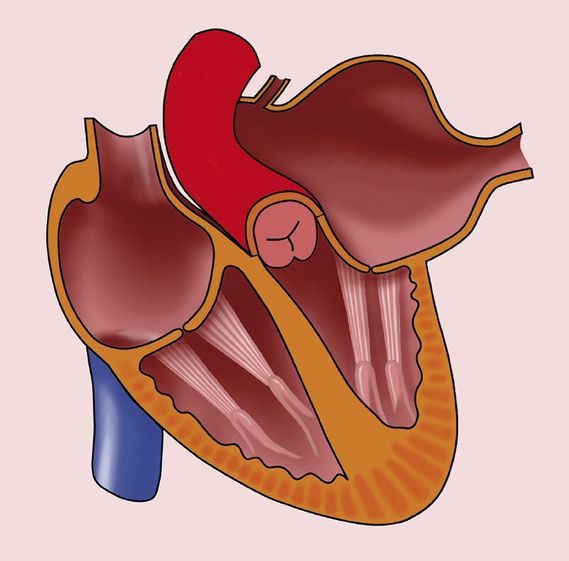
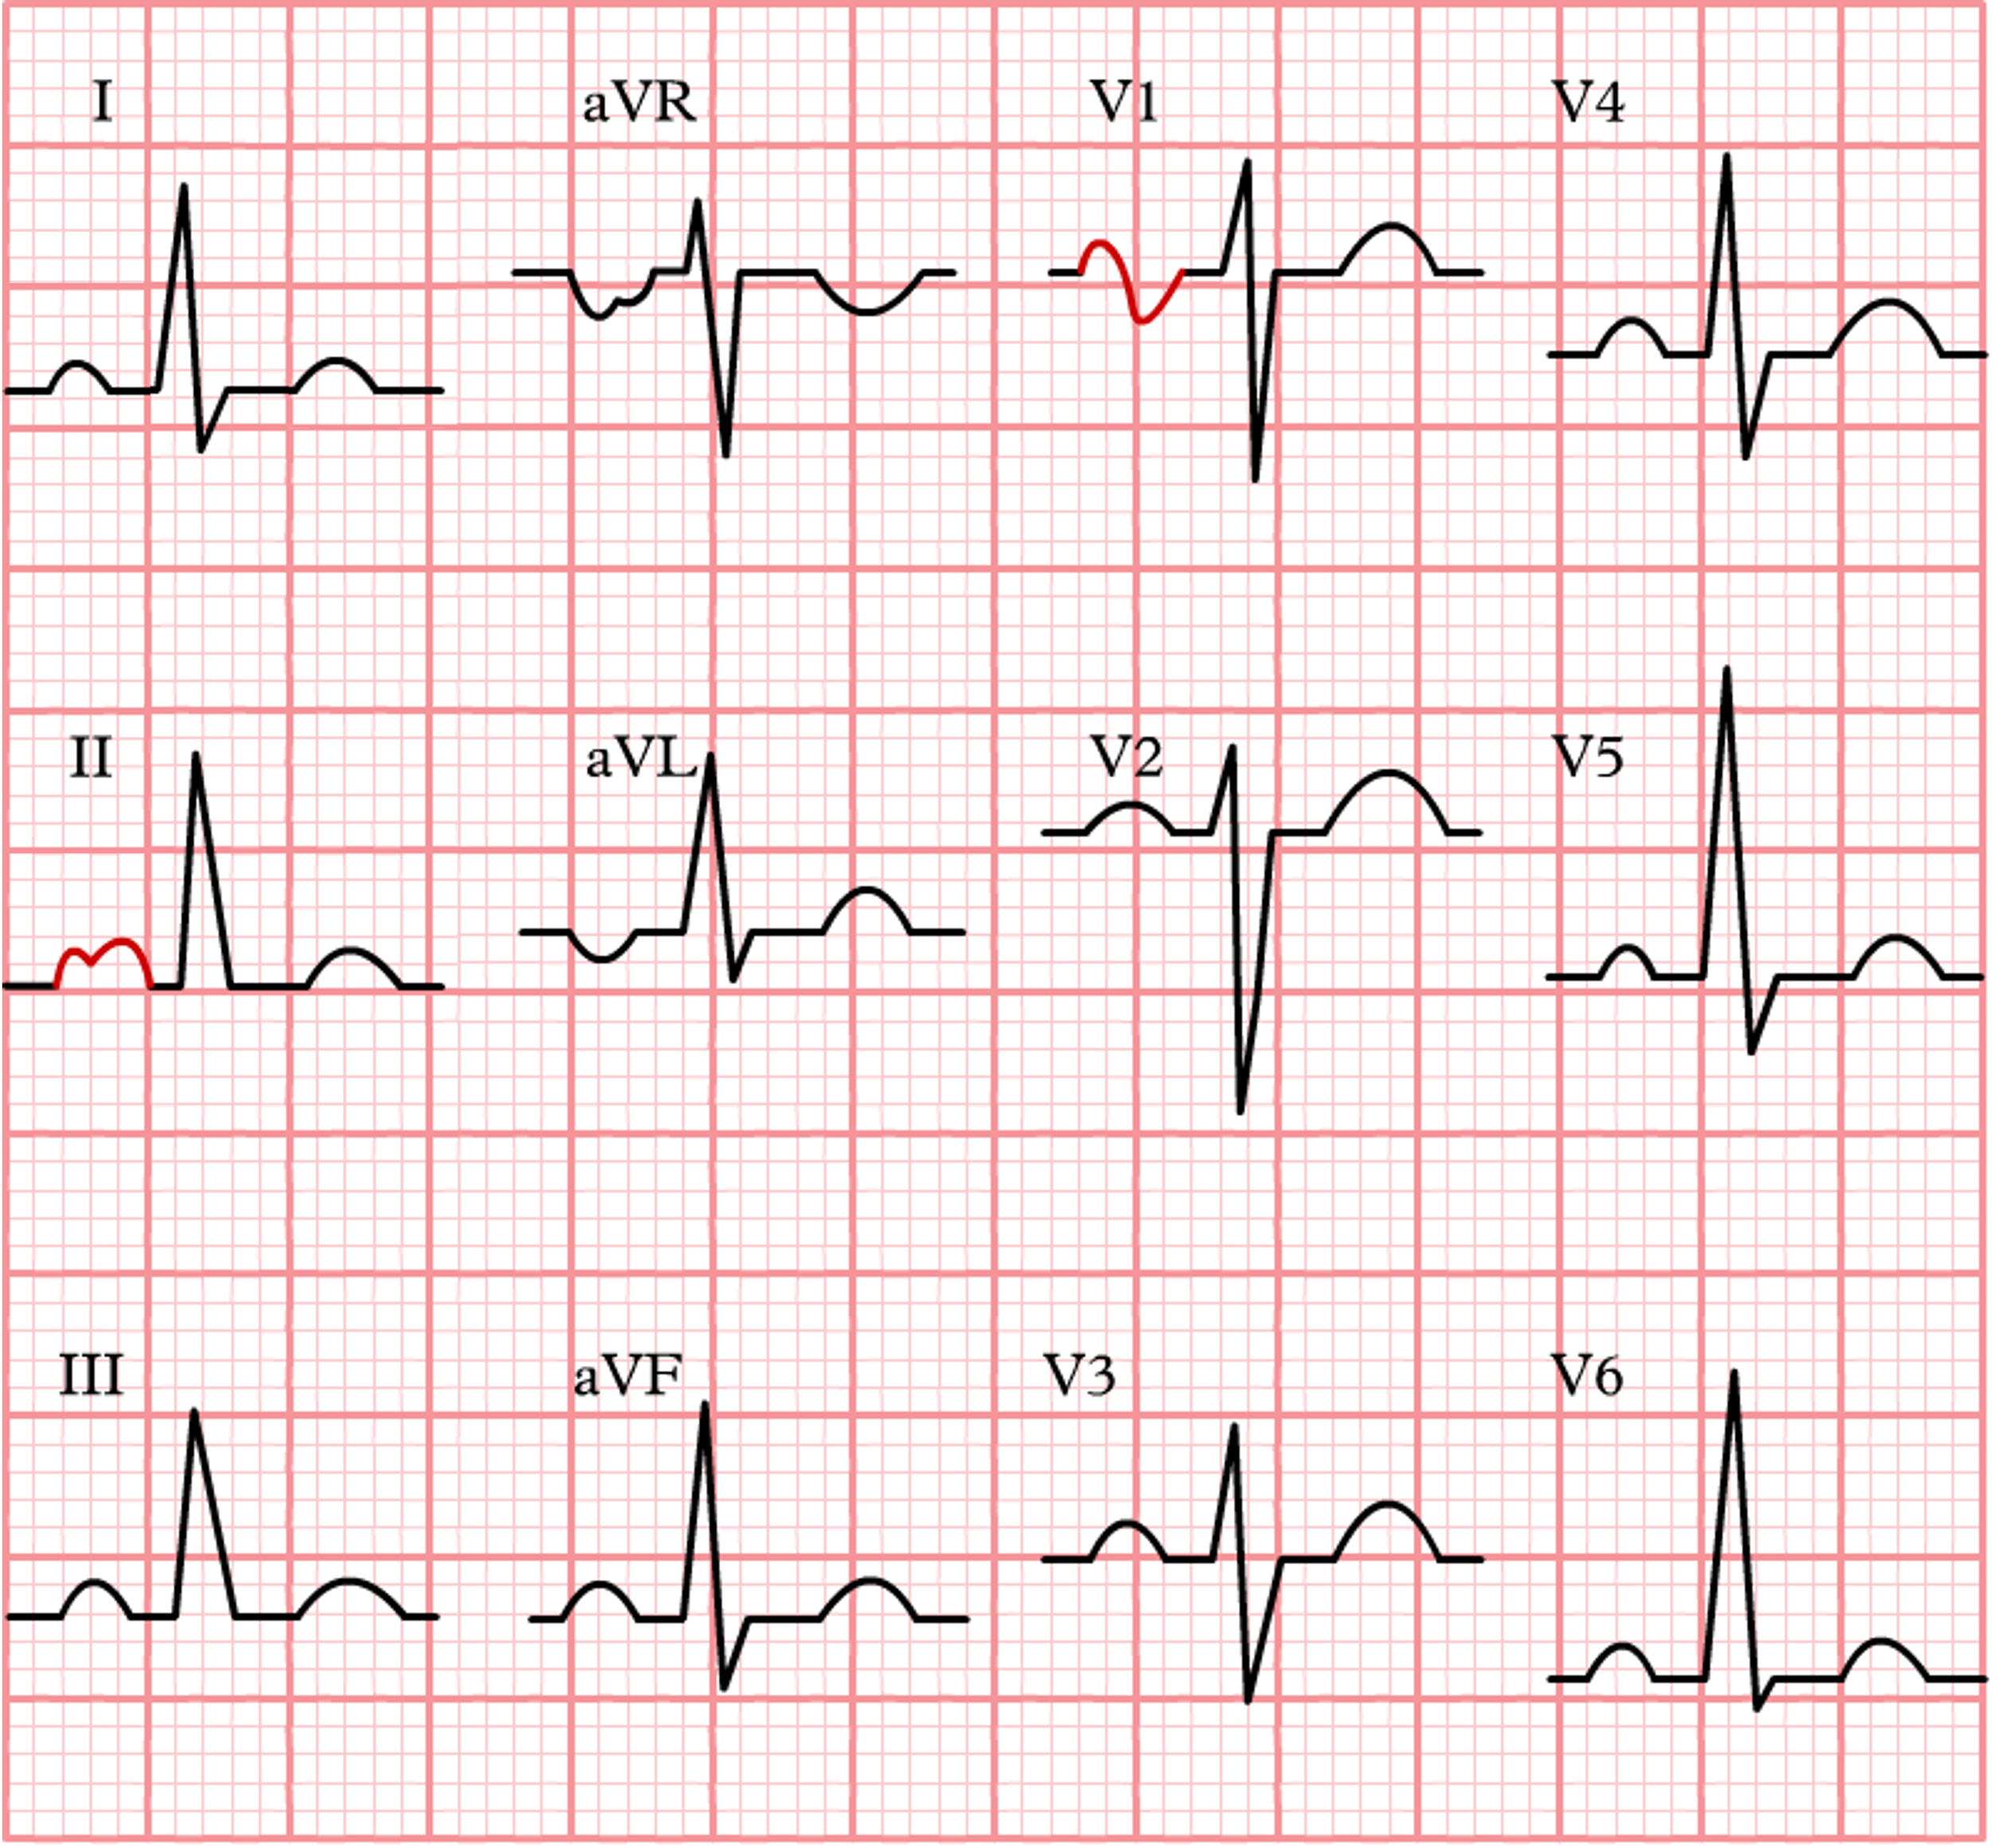
The left atrium plays a crucial role in cardiac function, serving as a reservoir and channel for oxygenated blood returning to the heart from the lungs. When this chamber enlarges due to chronic stress or disease, it leaves distinctive signs on the EKG. Left atrial enlargement is also called “P mitrale” because of its characteristic appearance on the EKG, specifically in lead II. The P wave in LAE often appears broad and notched due to delayed left atrial innervation, resembling the letter “M”, which is reminiscent of the mitral valve shape, hence the term “P mitrale” (mitral P wave).
Characteristics of LAE
- Leads to assess:
- Lead II: Examine the overall P wave shape and duration
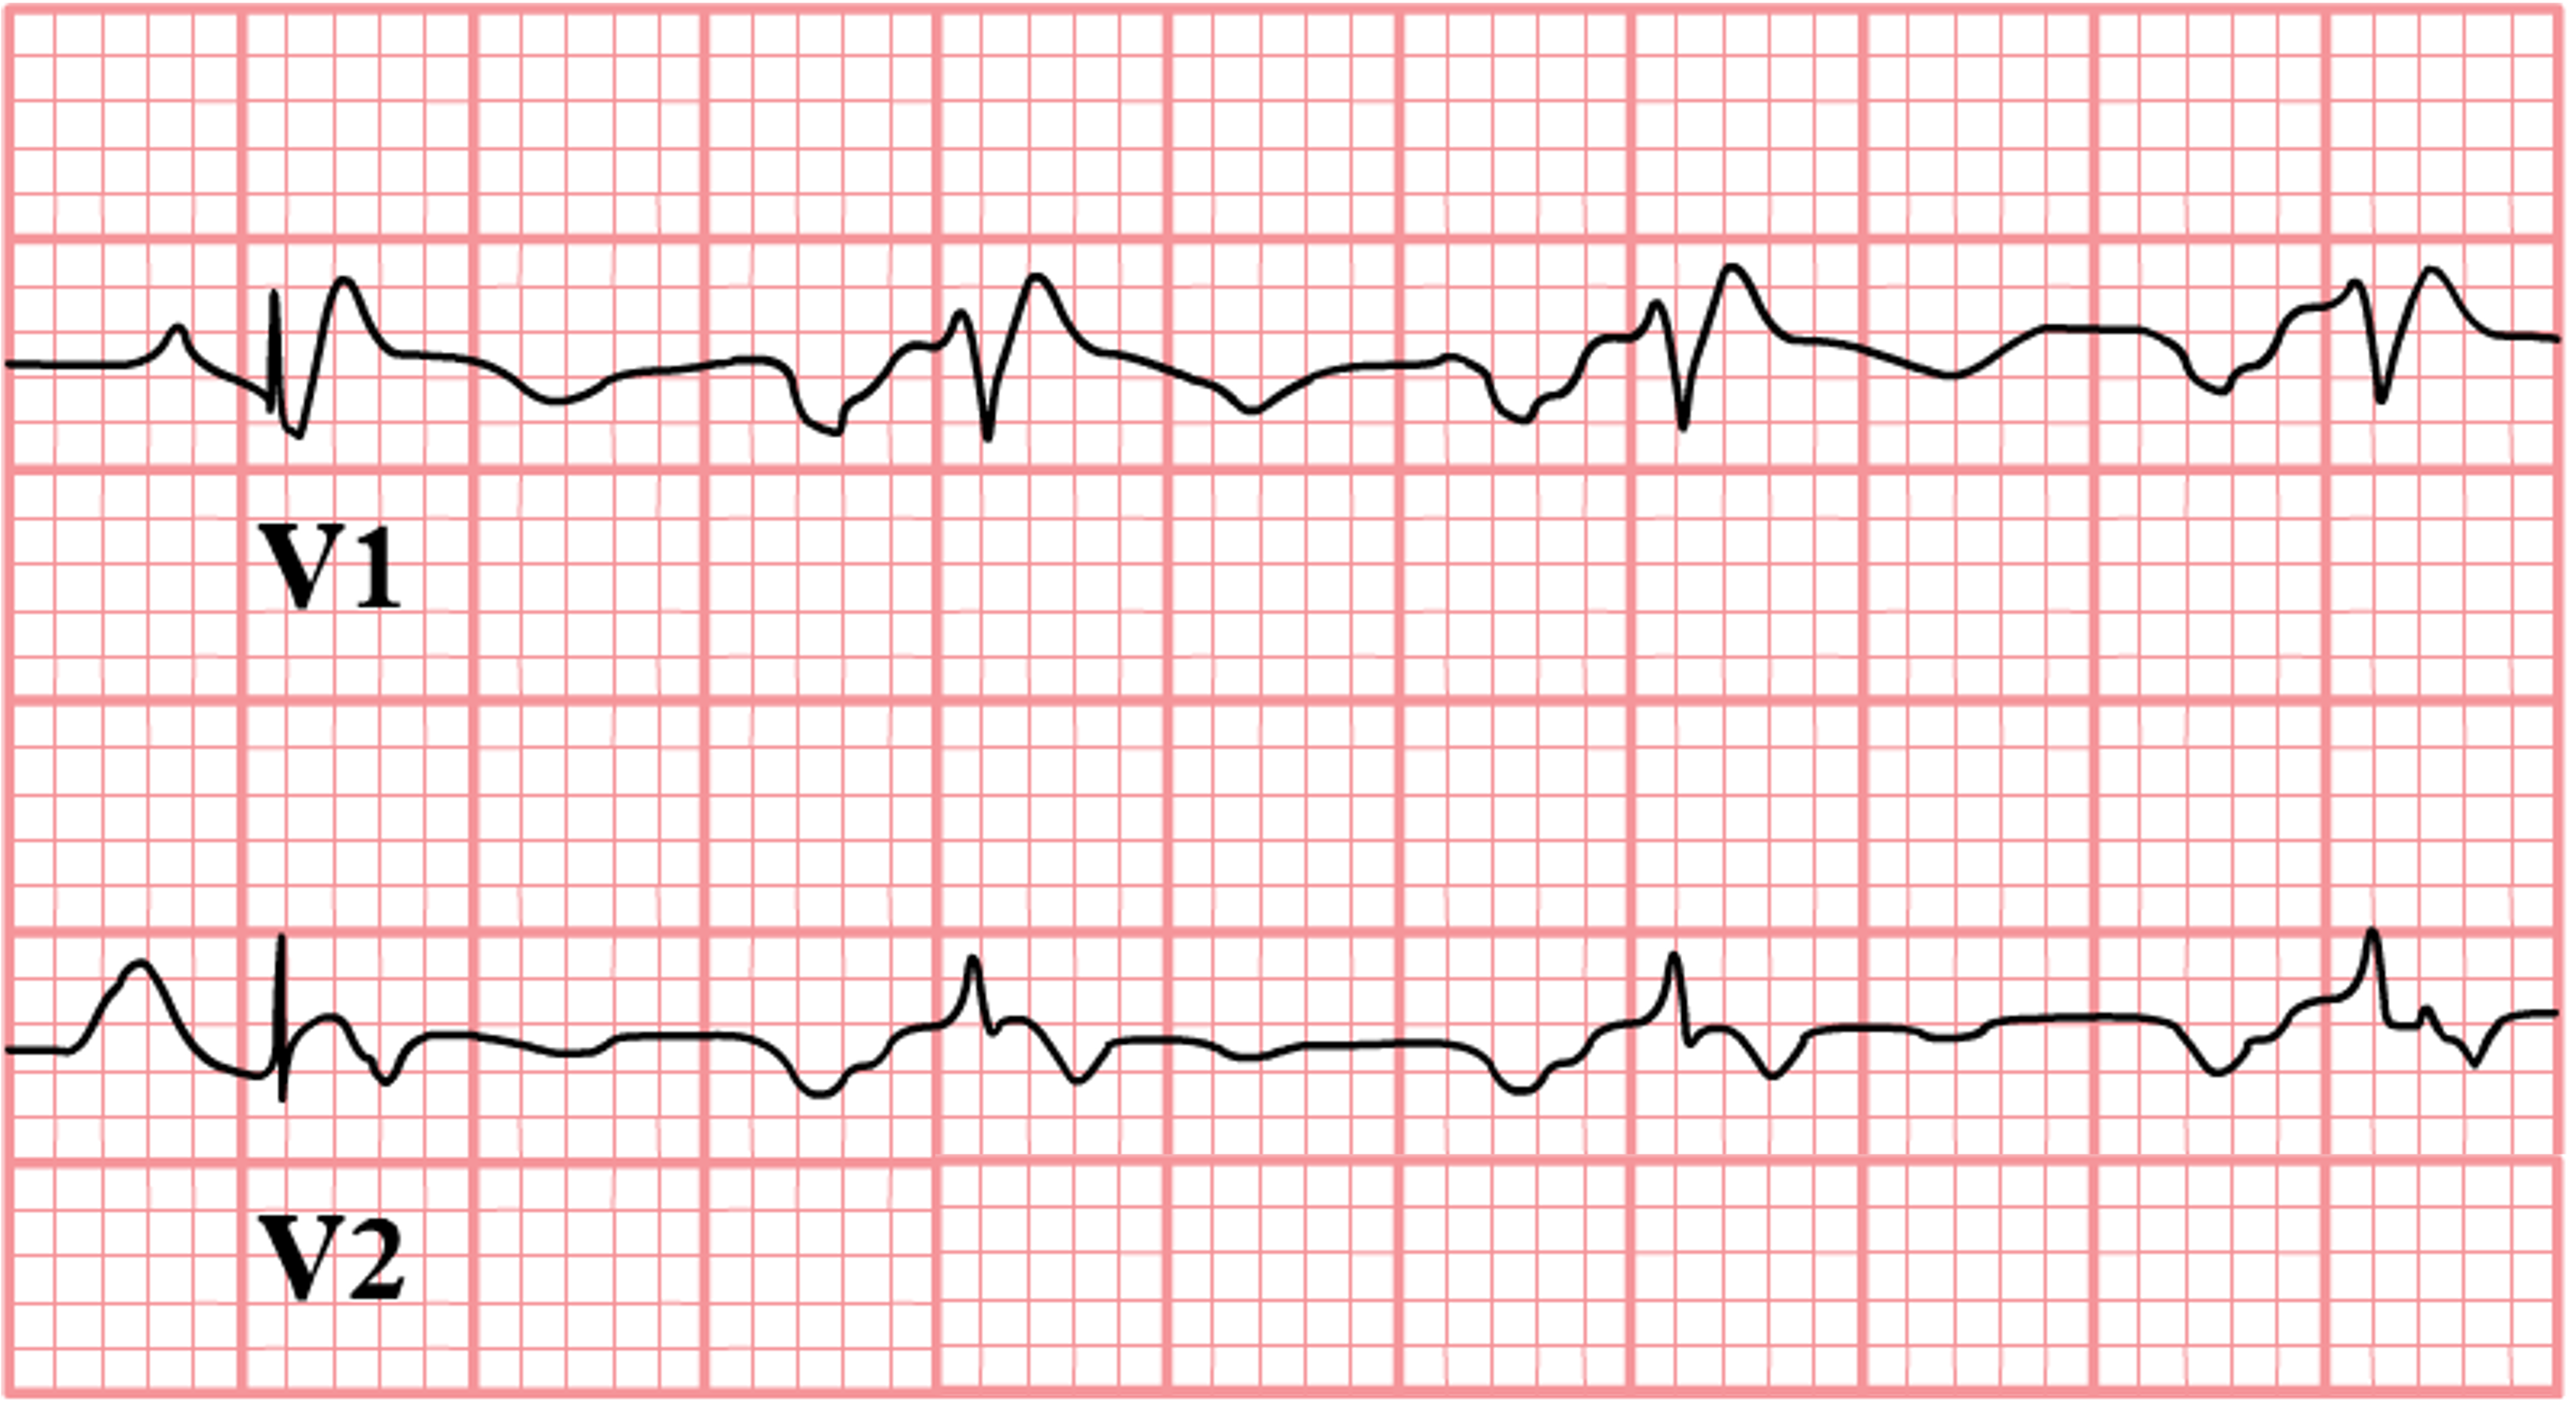
- Lead V1: Look for a specific P wave pattern
- The P wave in V1 typically has two components, an initial positive deflection followed by a negative deflection
- The negative deflection (or “dip”) at the end of the P wave is key for assessing LAE
- Criteria for interpretation, either:
- Prolonged P wave duration (≥0.12 secs) in lead II
- Notched P wave appearance in lead II with a gap >0.04 secs between the two peaks (P mitrale)
- In lead V1, look for a P wave with:
- A positive initial deflection followed by a negative deflection (i.e., a biphasic wave)
- The negative portion of the P wave being >0.04 secs in duration with a depth ≥1 mm below the isoelectric line
Clinical Significance
- Indicator of chronic left atrial pressure or volume overload
- Associated with elevated risk of atrial fibrillation and thrombosis
- Predictor of adverse cardiovascular outcomes and mortality
Signs & Symptoms
- Often asymptomatic in early stages
- May present with symptoms of underlying cause (e.g., dyspnea in mitral valve disease)
- Palpitations or irregular heartbeat if atrial fibrillation develops
Treatment
- Address underlying cause (e.g., blood pressure control, valve repair)
- Anticoagulation may be considered if atrial fibrillation develops
- Regular monitoring and follow-up to assess progression
Causes
- Hypertension
- Mitral valve disease (stenosis or regurgitation)
- Left ventricular dysfunction or heart failure
- Aortic valve disease (stenosis or regurgitation)
- Chronic atrial fibrillation
- Congenital heart defects affecting the left heart
2. Right Atrial Enlargement
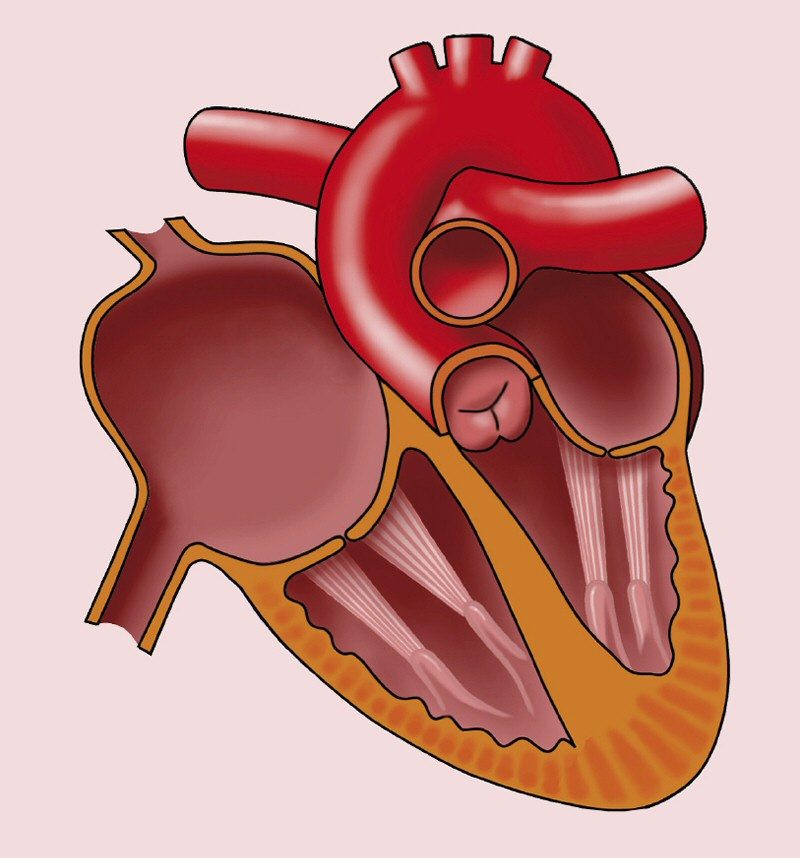
When the right atrium increases in size, it often occurs due to conditions that elevate right-sided cardiac pressure, altering the electrical signature of atrial depolarization with unique changes to the EKG. Recognizing these signs is crucial, as they can indicate underlying cardiac or pulmonary pathology. Right atrial enlargement is also called “P pulmonale” since it is commonly associated with pulmonary conditions, such as pulmonary hypertension, that increases chamber pressure of the right atrium. This results in a characteristic tall, peaked P wave on the EKG, particularly in the inferior leads, reflecting the strain on the right atrium due to pulmonary pathology.
Characteristics of RAE
- Leads to assess:
- Leads II, III, and aVF: Examine P wave amplitude
- Lead V1: Assess P wave shape and amplitude
- Criteria for interpretation, either:
- Peaked, pointed P waves with amplitude ≥2.5 mm in leads II, III, or aVF (P pulmonale)
- In lead V1, initial positive deflection of P wave amplitude ≥1.5 mm
- Width, or duration, of P wave does not change in any leads
Clinical Significance
- Indicator of right-sided cardiac pressure overload
- Associated with elevated risk of atrial arrhythmias
- May signal progression of underlying cardiopulmonary disease
Signs & Symptoms
- Often asymptomatic in early stages
- May present with symptoms of underlying cause (e.g., shortness of breath in pulmonary hypertension)
- Fatigue, peripheral edema, or right upper quadrant discomfort in advanced cases
Treatment
- Address underlying cause (e.g., treatment of pulmonary hypertension or tricuspid valve disease)
- Management of associated arrhythmias if present
- Regular monitoring and follow-up to assess progression
Causes
- Pulmonary hypertension
- Tricuspid valve disease (stenosis or regurgitation)
- Chronic lung disease (e.g., COPD, pulmonary fibrosis)
- Congenital heart defects affecting the right heart
- Right ventricular dysfunction or heart failure
Pathophysiology of Ventricular Hypertrophy
As we shift our focus from the atria to the ventricles, we encounter another form of cardiac adaptation to stress. The heart’s main pumping chambers respond to chronic pressure or volume overload by increasing muscle mass of the chamber walls. This process, triggered by conditions such as hypertension or valve disorders, initially serves as a compensatory mechanism to maintain cardiac function. However, this adaptation can eventually become counterproductive, leading to stiffened chambers and compromised function. The structural changes alter the heart’s electrical properties, manifesting as distinctive patterns in the QRS complex and ST-T segments on the EKG. These electrical changes serve as valuable clues, helping clinicians decipher the heart’s structural modifications and potential underlying issues.
Interpretation of Ventricular Hypertrophy
As the myocardial walls thicken in response to chronic stress, distinct patterns on the EKG become apparent. These electrical signatures manifest primarily in the QRS complex and ST-T segments, reflecting the increased muscle mass and accompanying altered conduction patterns. Clinicians examining an EKG for ventricular hypertrophy look for several key features: amplified QRS voltages, widened QRS complexes, and specific repolarization abnormalities (i.e., ST segment, T wave changes). These changes can vary depending on whether the left or right ventricle is predominantly affected. By systematically evaluating these EKG patterns, healthcare providers can gain valuable insights into the heart’s structural adaptations, which often indicate underlying cardiovascular conditions requiring further investigation and management.
It is worth noting that while the following criteria are widely used, EKG changes are an insensitive means of detecting ventricular hypertrophy. Patients with clinically significant ventricular hypertrophy as assessed via echocardiography may still have a relatively normal EKG. Therefore, echocardiography is generally considered more reliable for diagnosing ventricular hypertrophy.
3. Left Ventricular Hypertrophy
When the left ventricle faces persistent challenges in pumping blood against increased resistance or volume, such as from hypertension or aortic stenosis, it undergoes hypertrophy, thickening its muscular walls and creating distinct changes to the EKG. This increased muscle mass means there are more myocardial cells contributing to the electrical activity during each heartbeat. As a result, the electrical signals generated are stronger, leading to increased QRS amplitude and duration. In other words, the larger the cardiac muscle, the larger the electrical signal it produces. When interpreting EKGs for left ventricular hypertrophy (LVH), we can focus on increased QRS amplitudes in left-sided leads (i.e., leads I, aVL, V5, V6) and deep S waves in right-sided leads (i.e., leads III, V1, V2), while also considering non-voltage criteria like ST-T changes and left axis deviation. In clinical practice, there are several criteria used to identify LVH on an EKG. However, it is important to note that there is no single, universally accepted method. Different criteria may be used in different settings, but for the purposes of this text, we will focus on one primary method for clarity and simplicity. Keep in mind that while specific criteria are essential, the clinical context is vital for an accurate diagnosis.
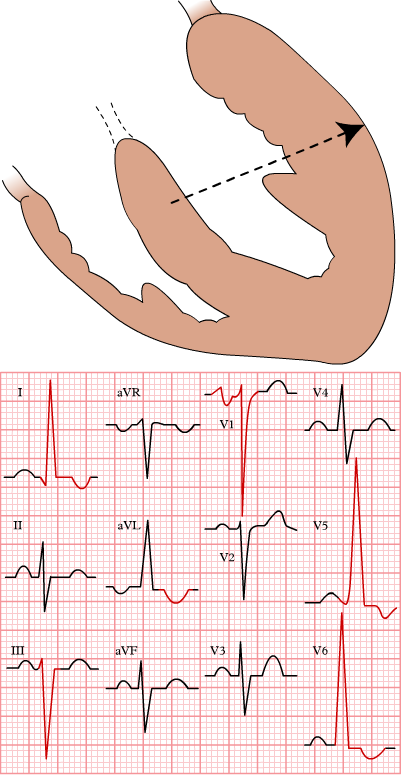
Characteristics of LVH
- Axis deviation: Left axis deviation, but not always present in LVH
- Leads to assess:
- Limb leads I, III, aVL, aVF
- Precordial leads V1, V2, V5, V6
- Voltage criteria for interpretation:
- Limb leads
- Lead I R wave + Lead III S wave = >25 mm
- Lead aVL R wave >11 mm
- Lead aVF >20 mm
- Precordial leads
- Lead V5 or V6 R wave >26 mm
- Lead V5 or V6 R wave + Lead V1 or V2 S wave >35 mm
- Largest R wave + largest S wave in precordial leads >45 mm
- Limb leads
- Non-voltage criteria for interpretation:
- Increased R wave peak time >50 ms in leads V5 or V6
- ST segment depression and T wave inversion in left-sided leads
Clinical Significance
- LVH is an independent risk factor for cardiovascular morbidity and mortality
- It is associated with an increased risk of arrhythmias and sudden cardiac death
- LVH indicates long-standing hypertension or other cardiac conditions
Signs & Symptoms
- Often asymptomatic in early stages
- May present with symptoms of underlying cause (e.g., shortness of breath, chest discomfort)
- Palpitations or irregular heartbeat if arrhythmias develop
Treatment
- Address underlying cause (e.g., blood pressure control, aortic valve replacement if stenosis is indicated)
- Medication to reduce cardiac workload (e.g., ACE inhibitors, beta-blockers)
- Regular monitoring and follow-up to assess progression and response to treatment
Causes
- Hypertension (most common cause)
- Aortic valve stenosis
- Hypertrophy cardiomyopathy
- Athletic heart syndrome
- Obesity
- Chronic kidney disease
Other Criteria for LVH Interpretation
Again, several criteria for LVH interpretation exist. Below are the most common ones.
- Cornell criteria = Lead aVL R wave + Lead V3 S wave = >28 mm in males; >20 mm in females
- Modified Cornell criteria = Lead aVL R wave = >12 mm
- Sokolow-Lyon criteria = Lead V1 S wave + Lead V5 or V6 R wave = >35 mm
- Romhilt-Estes LVH Point Score System: If the total score equals 4 indicates probable LVH, whereas a score of 5 or greater indicates definite LVH.
- Largest R wave or S wave in limb leads = ≥20 mm = 3 points
- Lead V1 or V2 S wave = ≥30 mm = 3 points
- Lead V5 or V6 R wave = ≥30 mm = 3 points
- ST-segment and T wave changes opposite of QRS complex without digoxin = 3 points
- ST-segment and T wave changes opposite of QRS complex with digoxin = 1 point
- Left atrial enlargement = 3 points
- Left axis deviation = 2 points
- QRS duration >90 ms = 1 point
- Intrinsicoid deflection in lead V5 or V6 > 50 ms = 1 point
4. Right Ventricular Hypertrophy
Right-sided heart complications typically stem from conditions affecting pulmonary circulation. Right ventricular hypertrophy (RVH) occurs when the right ventricle thickens in response to increased pressure or volume overload, often attributed to pulmonary pathologies such as pulmonary hypertension and chronic lung diseases. As previously explained, a hypertrophied myocardium leads to stronger electrical conduction, or greater amplitudes, which are valuable signs to examine for on the EKG. These key EKG changes associated with RVH include taller R waves in V1 and V2, deeper S waves in V5 and V6, and right axis deviation. It is important to note that while these EKG criteria for interpreting RVH are specific, they have low sensitivity. In other words, false positives are not uncommon with these criteria. Thus, clinical context and other diagnostic tools should be considered alongside EKG findings for a comprehensive evaluation of suspected RVH.
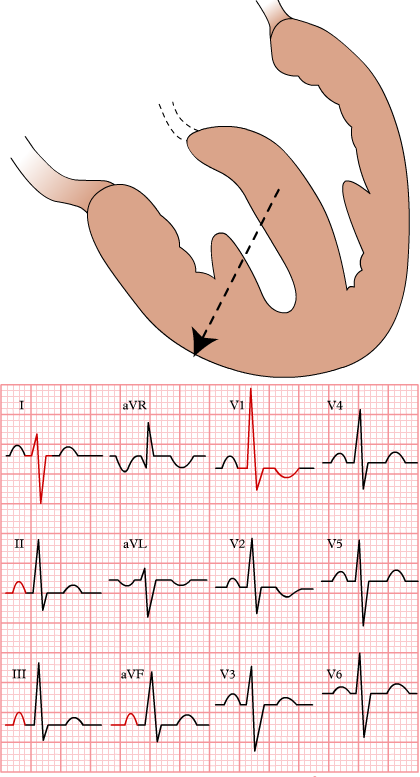
Characteristics of RVH
- Axis deviation: Right axis deviation of +100º or greater
- Leads to assess:
- Precordial leads V1, V5, V6
- Voltage criteria for interpretation:
- Lead V1 R wave ≥7 mm tall (or R wave/S wave ratio >1.0)
- Lead V5 or V6 S wave ≥7 mm deep (or R wave/S wave ratio <1.0)
- Lead V1 R wave + Lead V5 or V6 S wave = >10.5 mm
- QRS duration <0.12 secs (i.e., changes not attributed to right bundle branch block)
- Additional supporting criteria:
- Right atrial enlargement
- ST depression and T wave inversion in right precordial leads V1–V4 and inferior leads II, III, aVF (known as right ventricular strain pattern)
- Deep S waves in lateral leads I, aVL, V5, V6
Clinical Significance
- RVH is an indicator of right-sided cardiac pressure or volume overload
- It is associated with conditions such as pulmonary hypertension and chronic lung disease (e.g., COPD, pulmonary embolism)
- RVH can lead to right-sided heart failure and arrhythmias
Signs & Symptoms
- Often asymptomatic in early stages
- May present with symptoms of underlying cause (e.g., shortness of breath, fatigue)
- Peripheral edema, abdominal edema, right-upper quadrant pain
Treatment
- Address underlying cause (e.g., management of pulmonary hypertension or chronic lung disease)
- Medication to reduce right ventricular workload (e.g., diuretics, pulmonary vasodilators)
- Regular monitoring and follow-up to assess progression and response to treatment
Causes
- Pulmonary hypertension (primary or secondary)
- Chronic lung diseases (e.g., COPD, interstitial lung disease)
- Congenital heart defects (e.g., tetralogy of Fallot, isolated pulmonary stenosis)
- Pulmonary embolism
- Regurgitation from tricuspid valve disease or pulmonary valve disease
- Right ventricular outflow tract obstruction
Image Attributions:
Fig. 10.1 – “Left atrial enlargement” by Rob Kreuger is licensed under CC BY-NC-SA 3.0 / Cropped from original
Fig. 10.2 – “LAE” by CardioNetworks is licensed under CC BY-NC-SA 3.0 / Cropped from original and removed logo, swapped lead I and II tracings
Fig. 10.3 – “LAE-V1” by CardioNetworks is licensed under CC BY-NC-SA 3.0 / Removed title and logo
Fig. 10.4 – “Right atrial enlargement” by Rob Kreuger is licensed under CC BY-NC-SA 3.0 / Cropped from original
Fig. 10.5 – “RAE” by CardioNetworks is licensed under CC BY-NC-SA 3.0 / Cropped from original and removed logo
Fig. 10.6 – “LVH” by CardioNetworks is licensed under CC BY-NC-SA 3.0 / Cropped from original
Fig. 10.7 – “RVH” by CardioNetworks is licensed under CC BY-NC-SA 3.0 / Cropped from original
