2 How to Interpret Rhythm Strips
8 Step Method
1. Determine the rhythm
-
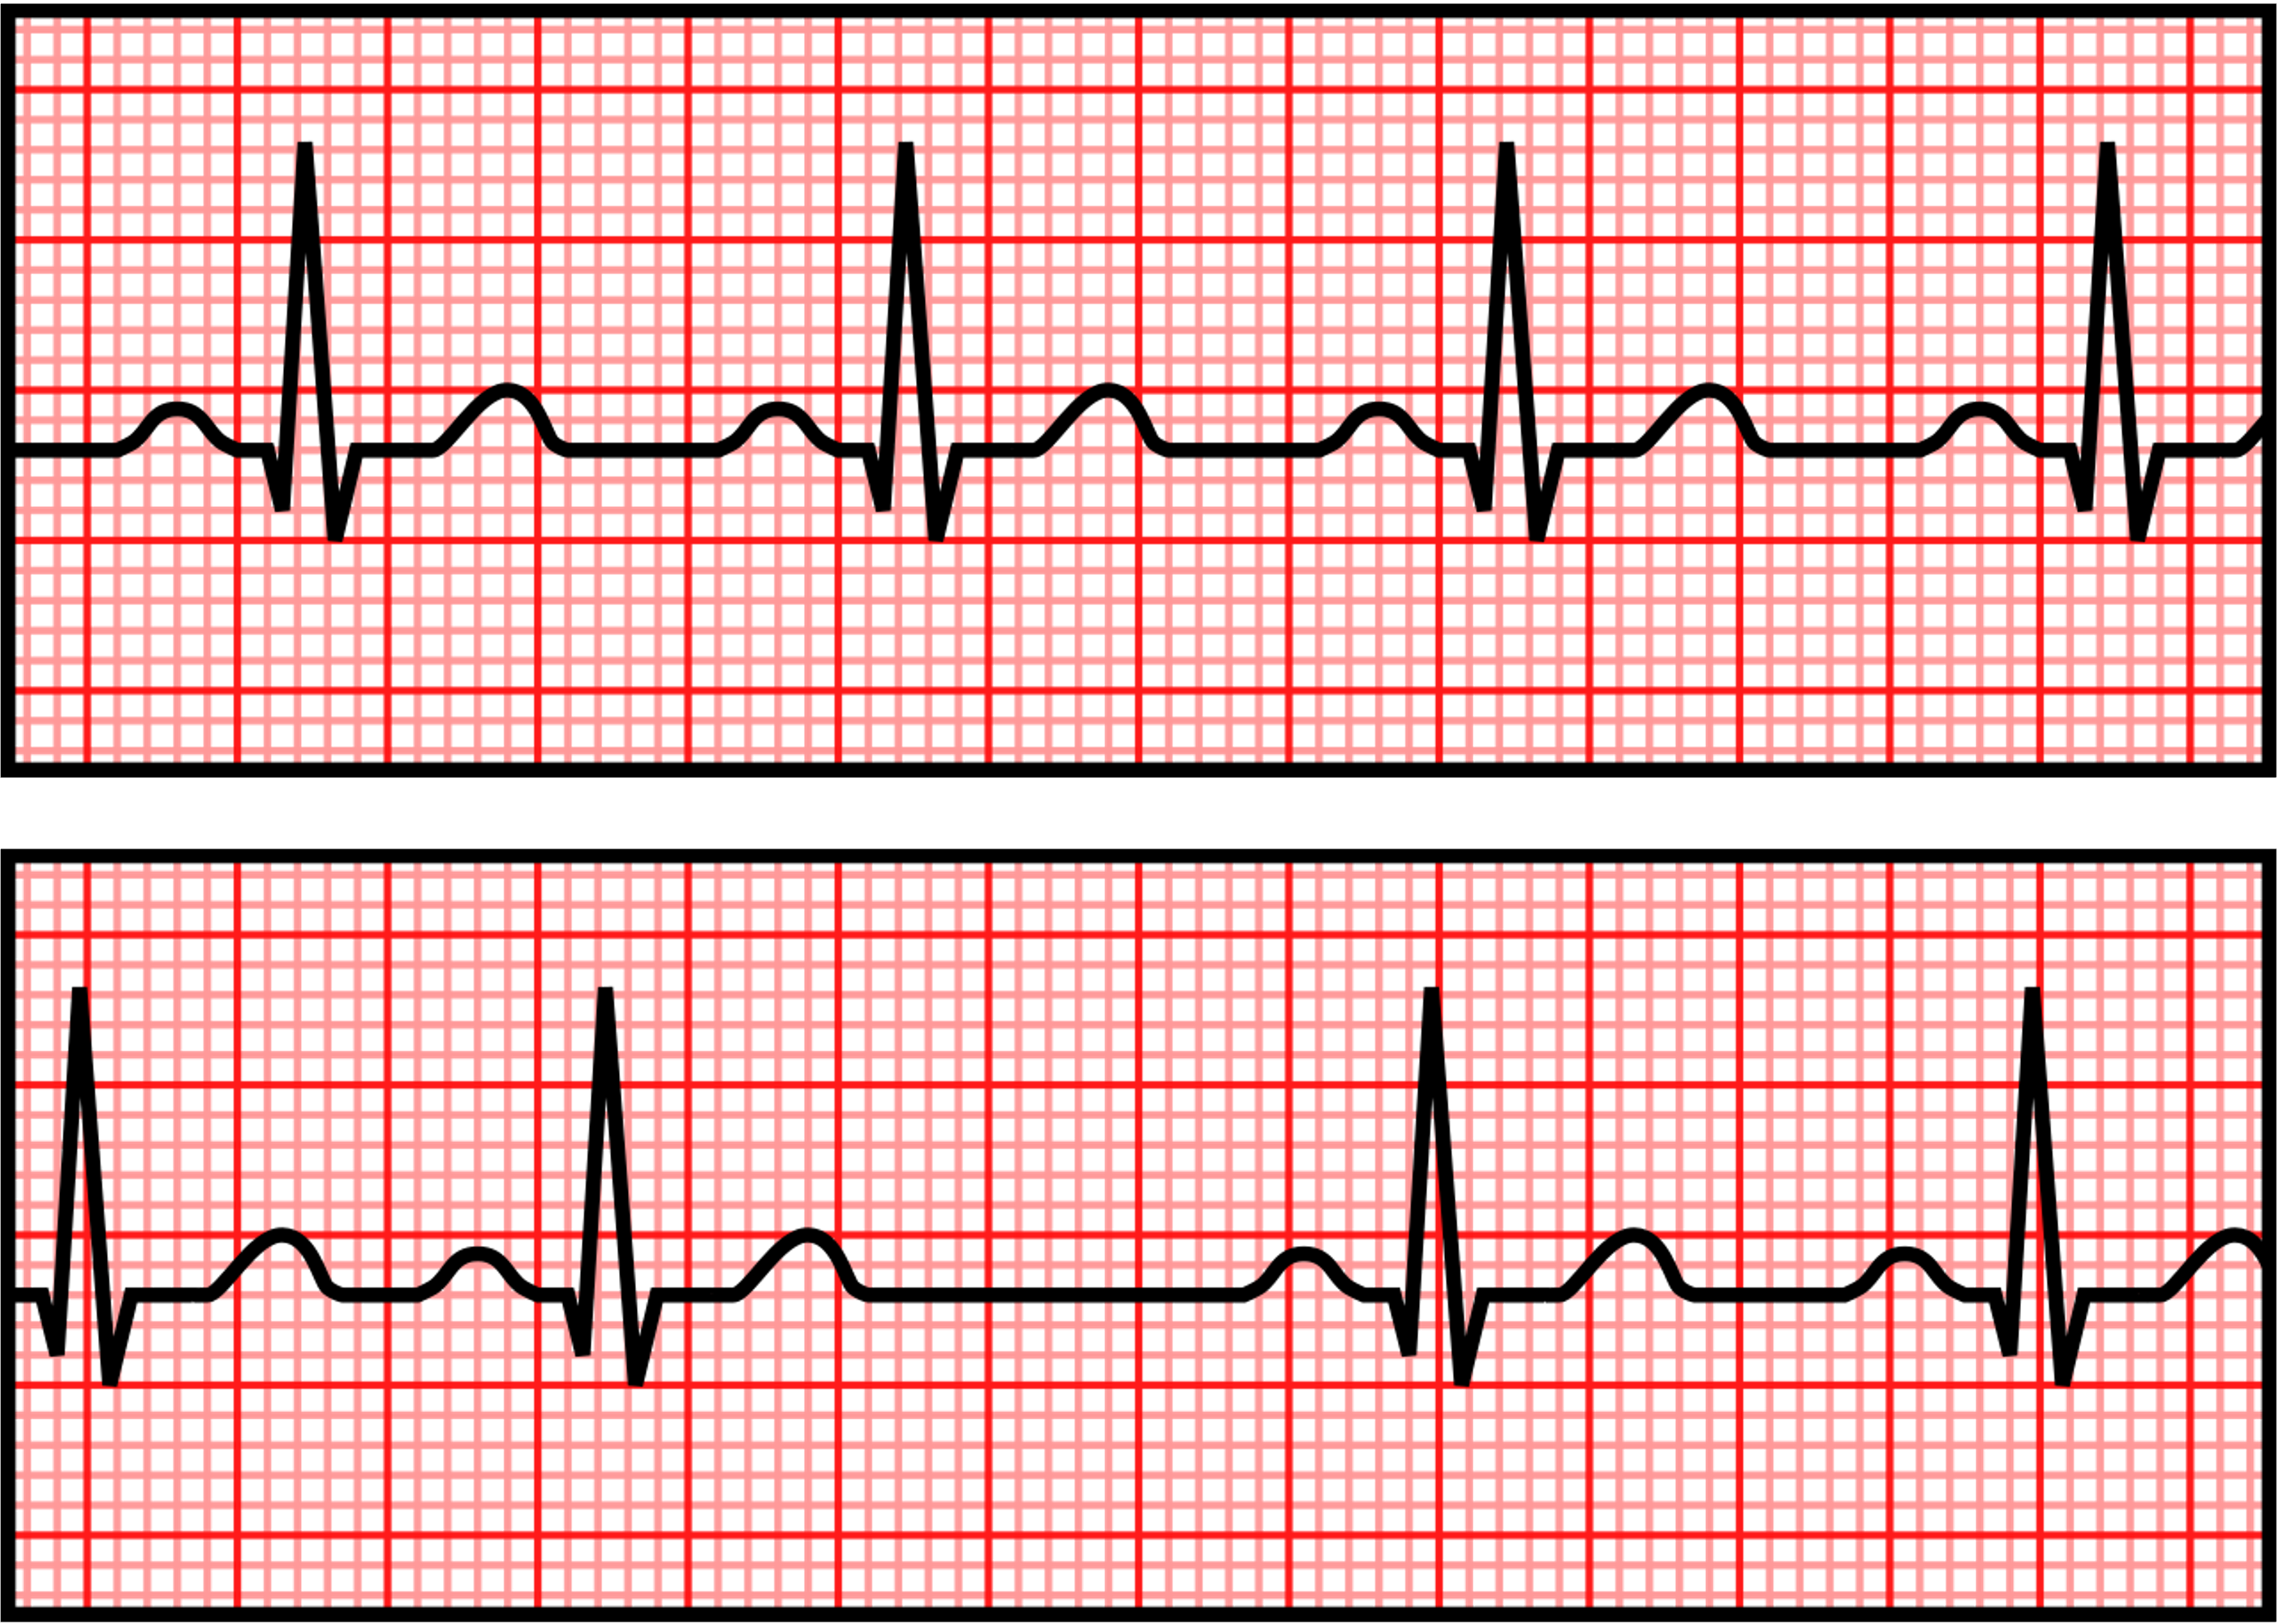
- The time from one P wave to the next P wave is the P-P interval, while the R-R interval is the time between one R wave and the subsequent R wave.
- A regular rhythm is determined when the P-P intervals and R-R intervals are consistent across the EKG tracing.
- The intervals are identical beat-by-beat because the atria and ventricles are being electrically stimulated at a constant rate.
- P-P and R-R interval variations of 0.04 seconds or less are normal.
- Assess whether the P-P and R-R intervals are constant across the rhythm strip and equal to each other.
- If the rhythm is irregular, assess whether the irregularity is caused by early or late beats or whether the rhythm is irregularly irregular, meaning it is regular between some beats but also irregular between other beats.
2. Determine the heart rate
A) Rapid estimation
-
-
-
- For regular rhythms, the number of large boxes between P waves or R waves can be used as a guide to estimate the atrial or ventricular rate.
- Memorization of “300, 150, 100, 75, 60, 50” represents the heart rate associated with number of large boxes between beats. For example, if a regular rhythm is measured to have three large boxes consistently between P waves, or R waves, then the heart rate is approximately 100 beats per minute (bpm). See Figure 2.2.
- Classify the rate as bradycardia, normal, or tachycardia.
- Note. Applicable only to paper speeds of 25 mm/sec (standard in most countries).
-
-

B) 10-times method
-
-
-
- Simply count the number of P waves or R waves on a 6-second rhythm strip and multiply by 10.
- This method is useful for estimating an average heart rate for irregular rhythms.
-
-
C) 1500 method
-
-
-
- For determining the atrial rate, count the number of small boxes between two P waves and divide by 1500.
- To determine the ventricular rate, count the number of small boxes between two R waves and divide by 1500.
-
-
D) 300 method
-
-
-
- Similar to the 1500 method, except, the number of large boxes are counted between two P waves or R waves and divided by 300.
-
-
3. Evaluate the P wave
-
- Is there a P wave preceding every QRS complex?
- Assess the presence, shape, and duration of the P wave.
- Determine if the P waves are consistent with sinus rhythm or atrial arrhythmias.
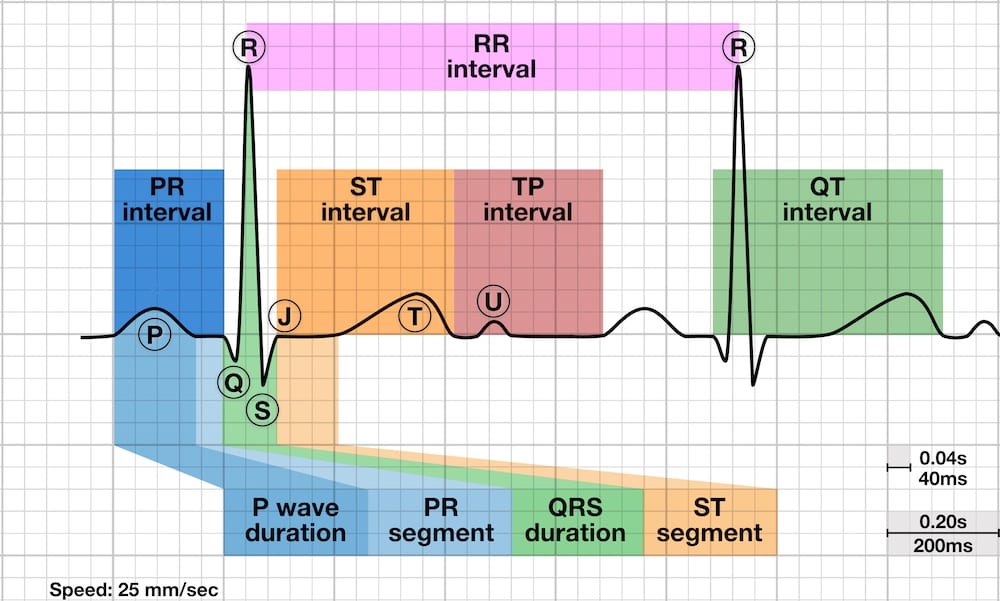
4. Determine PR interval duration
-
- Measured from the onset of the P wave to the beginning of the QRS complex.
- A normal PR interval is 0.12 – 0.20 secs in duration (i.e., 3 – 5 small boxes).
- PR intervals greater than 0.20 secs (i.e., >5 small boxes) indicate atrioventricular (AV) conduction issues.
- PR intervals shorter than 0.12 secs (i.e., <3 small boxes) represent an atrial impulse that found a shortcut to the ventricles.
- Classify the PR interval as normal, prolonged, or shortened.
5. Determine QRS complex duration
-
- Measure the duration of the QRS complex from the beginning of the initial deflection to the end of the final deflection.
- A normal, also referred to as narrow, QRS complex is 0.08 – 0.10 secs in duration (i.e., 2.0 – 2.5 small boxes).
- A wide QRS complex (i.e., ≥0.12 secs) may indicate AV conduction delays or the impulse is originating from the ventricles instead of being initiated by the SA node.
- Classify the QRS complex duration as normal or wide.
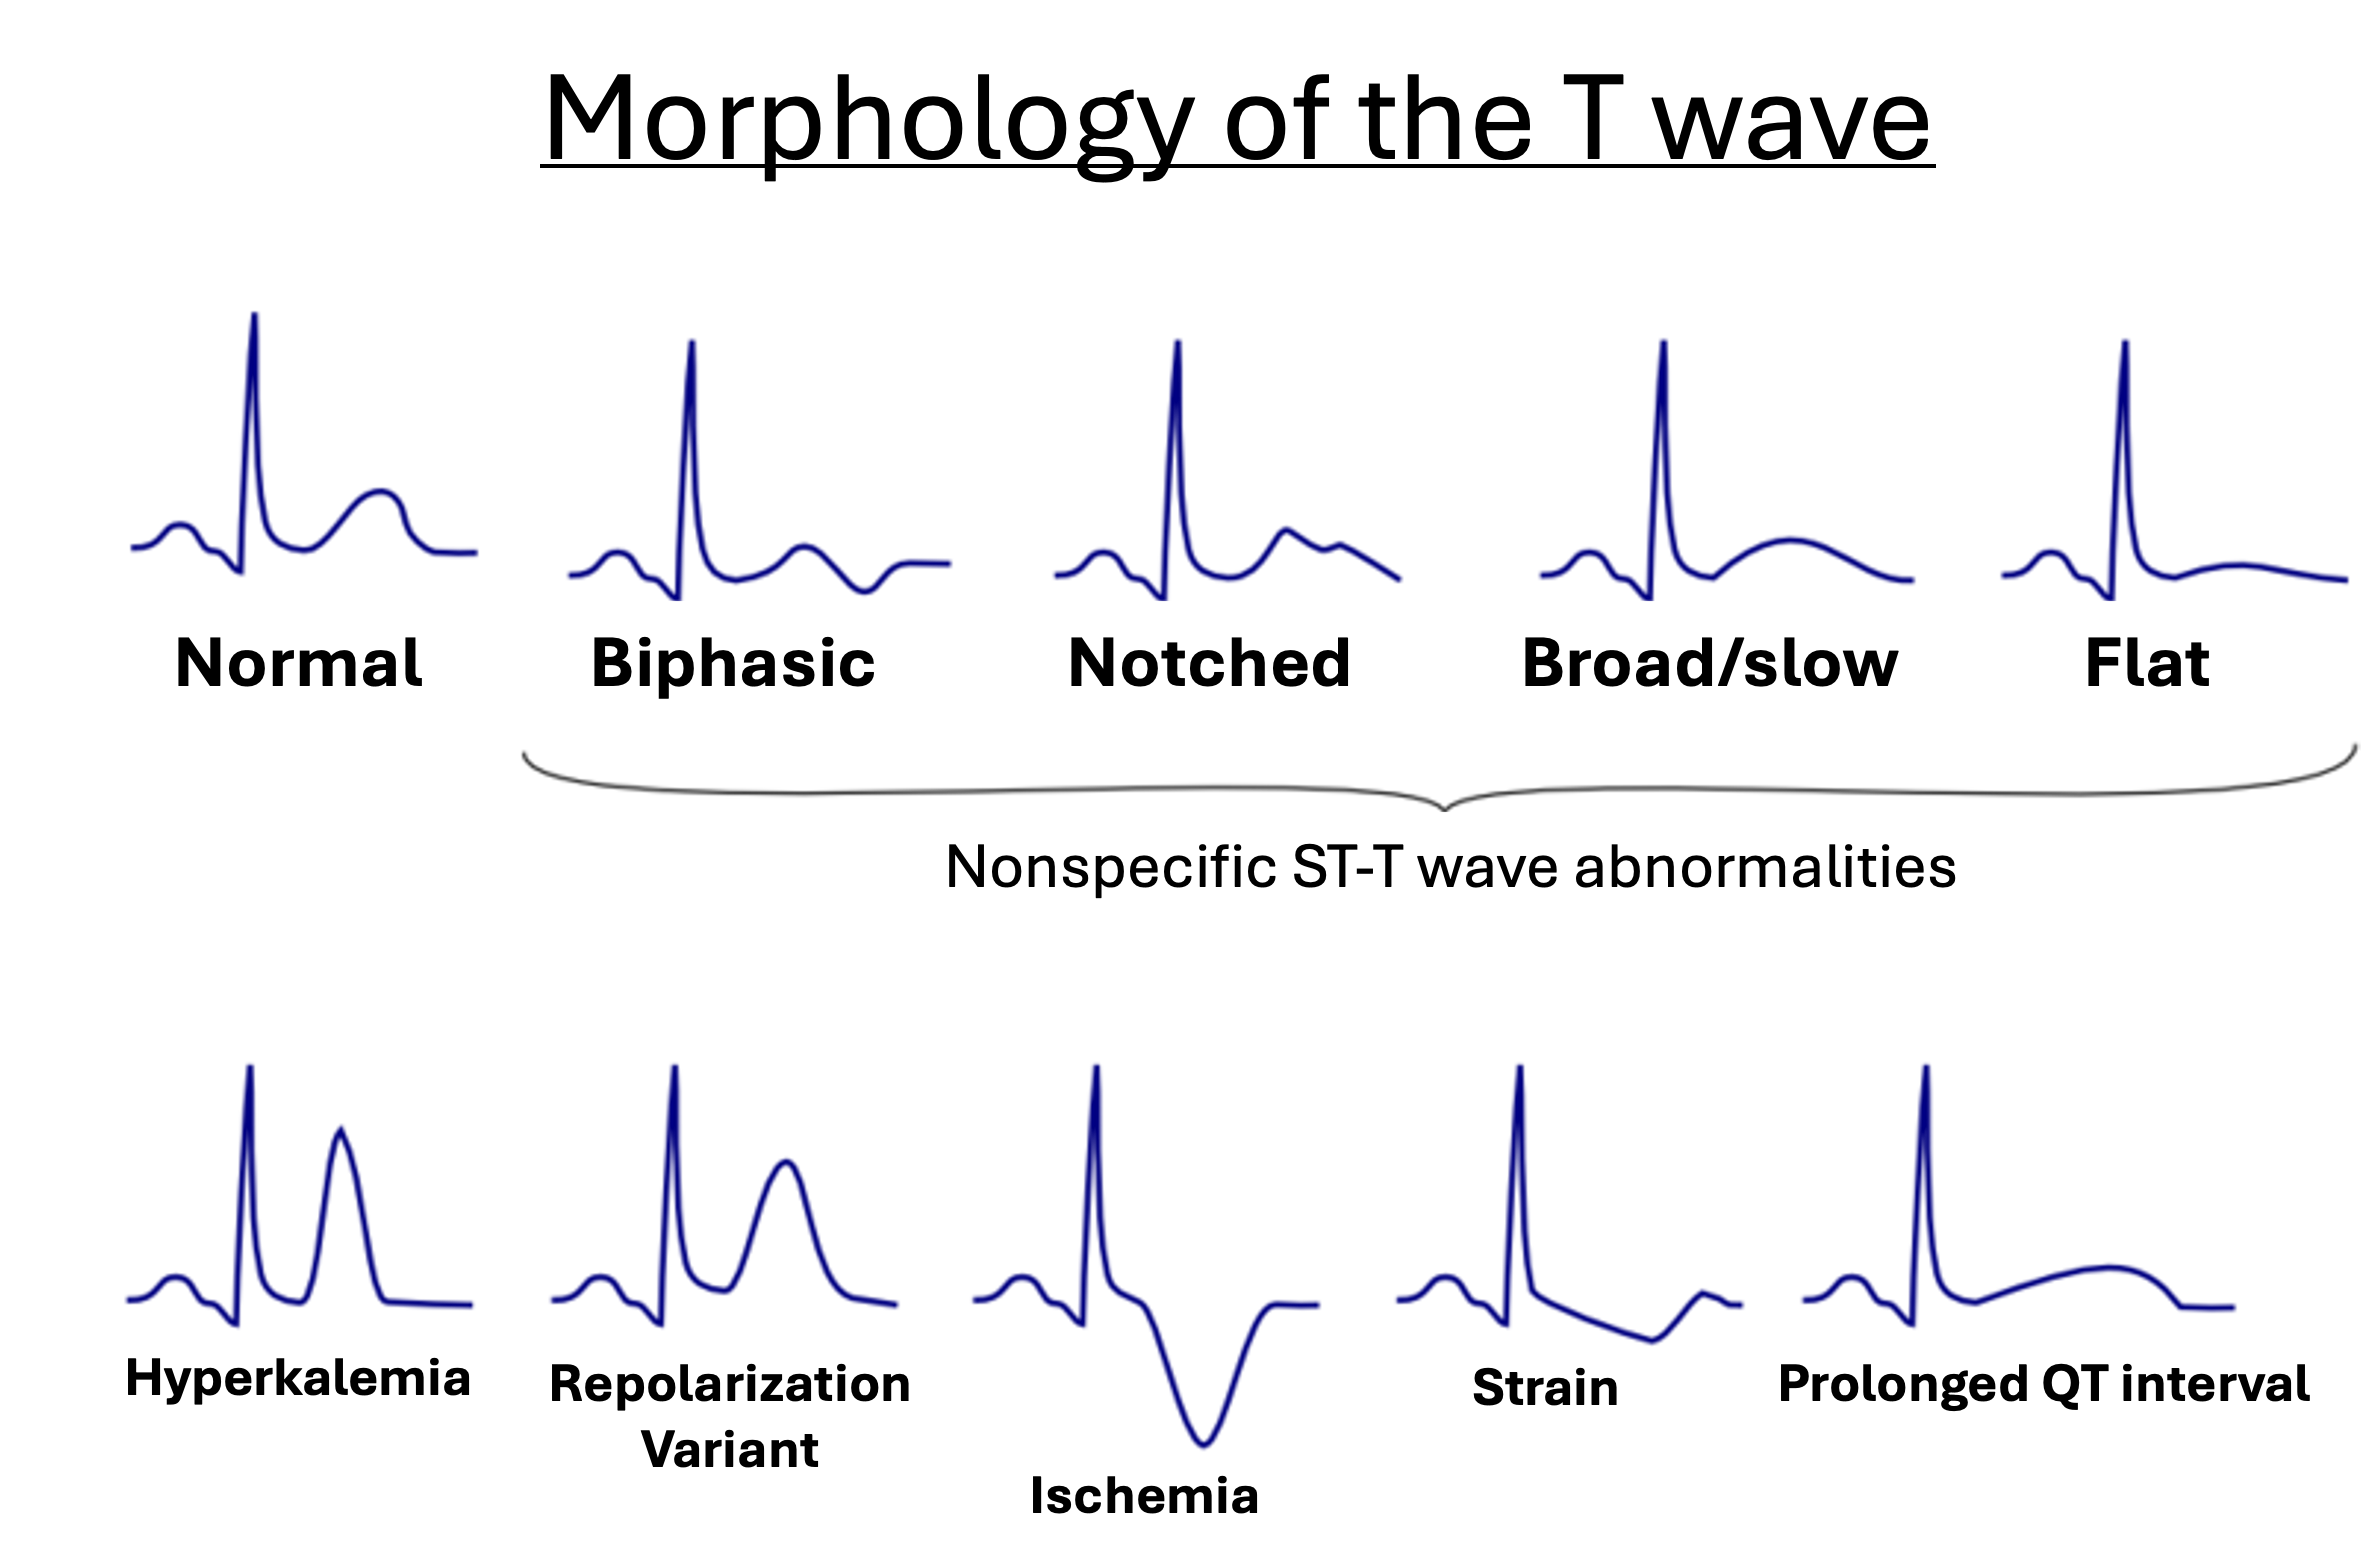
6. Evaluate the T wave and ST segment
-
- Are T waves present?
- Do the T waves appear normal in shape and amplitude? Identify any abnormalities, such as inverted, biphasic, or peaked T waves.
- Does the ST segment follow the isoelectric line or is it elevated or depressed? May indicate myocardial ischemia or injury.
7. Determine the QT interval
-
- Count the number of small squares between the beginning of the QRS complex and the end of the T wave. Multiply this number by 0.04.
- Correct the QT interval (QTc) for the heart rate using appropriate formulas.
- A normal QTc interval is 0.35 – 0.45 secs in males and 0.36 – 0.46 in females.
- An abnormally prolonged or shortened QTc interval is associated with greater risk of paroxysmal atrial and ventricular arrhythmias (e.g., Torsades de Pointes) or sudden cardiac death.
8. Assess the rhythm strip and patient
-
- Integrate all your findings from steps 1 – 7.
- Correlate the EKG interpretation with the patient’s clinical presentation and history.
- How is the patient tolerating the rhythm?
Characteristics of a Normal EKG
| Rhythm |
|
| Rate |
|
| P waves |
|
| PR interval |
|
| QRS complexes |
|
| ST segments |
|
| T waves |
|
| QT interval |
|
| Isoelectric line |
|
Practice Rhythm Strip Interpretation
Example A: Question 1
Example A: Question 2
Example A: Question 3
Example A: Question 4
Example A: Question 5
Example A: Question 6
Example A: Question 7
Example A: Question 8
Example A: Question 9
Example B: Question 1
Example B: Question 2
Example B: Question 3
Example B: Question 4
Example B: Question 5
Example B: Question 6
Example B: Question 7
Example B: Question 8
Example C: Question 1
Example C: Question 2
Example C: Question 3
Example C: Question 4
Example C: Question 5
Example C: Question 6
Example C: Question 7
Example C: Question 8
Image Attributions:
Fig. 2.1 – This work, “Regular vs. Irregular rhythm”, is adapted from “Normal Sinus Rhythm” and “Sinus Arrhythmia” by Rocuronium Bromide, which are dedicated to the public domain under CC0. “Regular vs. Irregular rhythm” is licensed under CC BY-NC 4.0 by Dr. Joshua E. McGee
Fig. 2.2 – “TheMarkerMethod” by Esther Lee is licensed under CC BY-SA 4.0 / edited to remove logo
Fig. 2.3 – “De-T wave morphology” by CardioNetworks is licensed under CC BY-SA 3.0 / logo cropped out, title and font remixed
Fig. 2.4 – “ECG waves segments and intervals LITFL ECG library 3” by Ed Burns and Robert Buttner is licensed under CC BY-SA 4.0
A condition characterized by a slower than normal heart rate, typically defined as fewer than 60 beats per minute.
A condition where the heart beats faster than normal, specifically over 100 beats per minute at rest.
The first deflection on an electrocardiogram that represents the electrical depolarization of the atria.
The time measured from the beginning of the P wave to the beginning of the QRS complex on an electrocardiogram, reflecting the conduction time through the atria and atrioventricular node.
A combination of three deflections on an electrocardiogram that represents the electrical activity of ventricular depolarization, typically lasting 0.08 to 0.10 seconds in healthy adults.
The deflection on an electrocardiogram that occurs after the QRS complex and represents ventricular repolarization.
The flat section on an electrocardiogram between the end of the S wave and the beginning of the T wave, representing the period between ventricular depolarization and repolarization.
The time measured from the beginning of the QRS complex to the end of the T wave on an electrocardiogram, representing the duration of ventricular depolarization and repolarization.
