9 How to Interpret 12-Lead EKGs
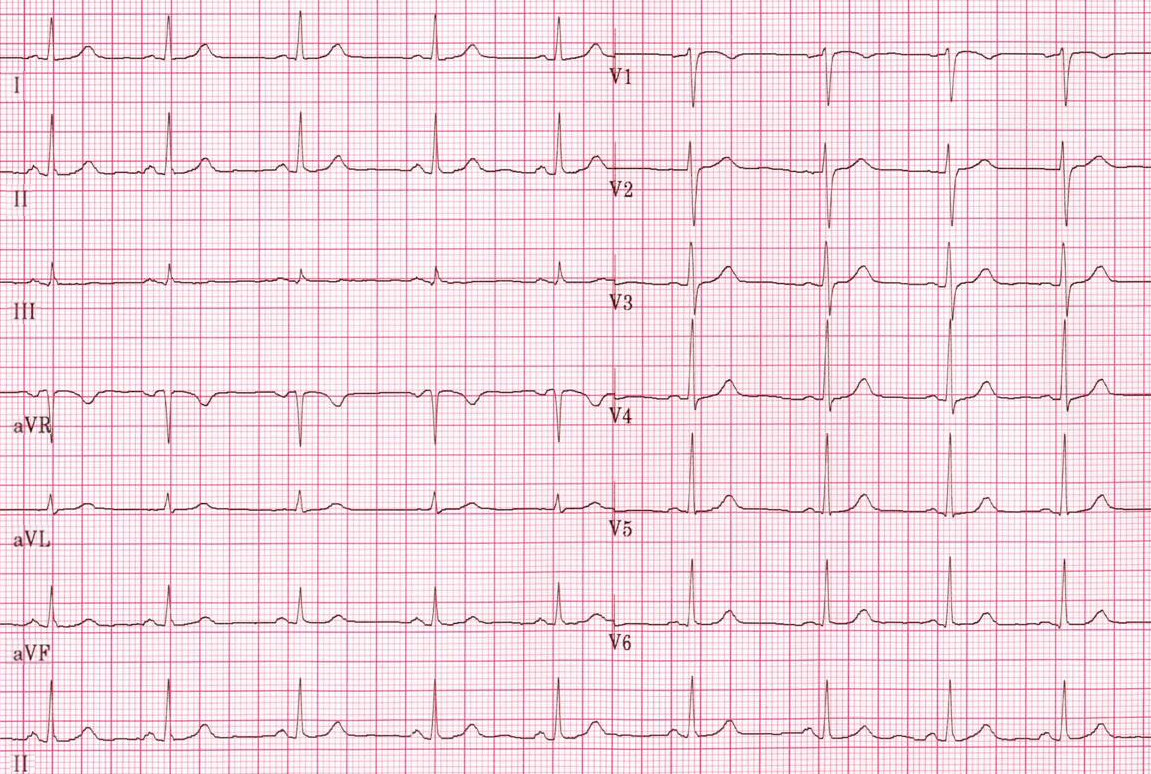
Characteristics of a Normal 12-Lead EKG
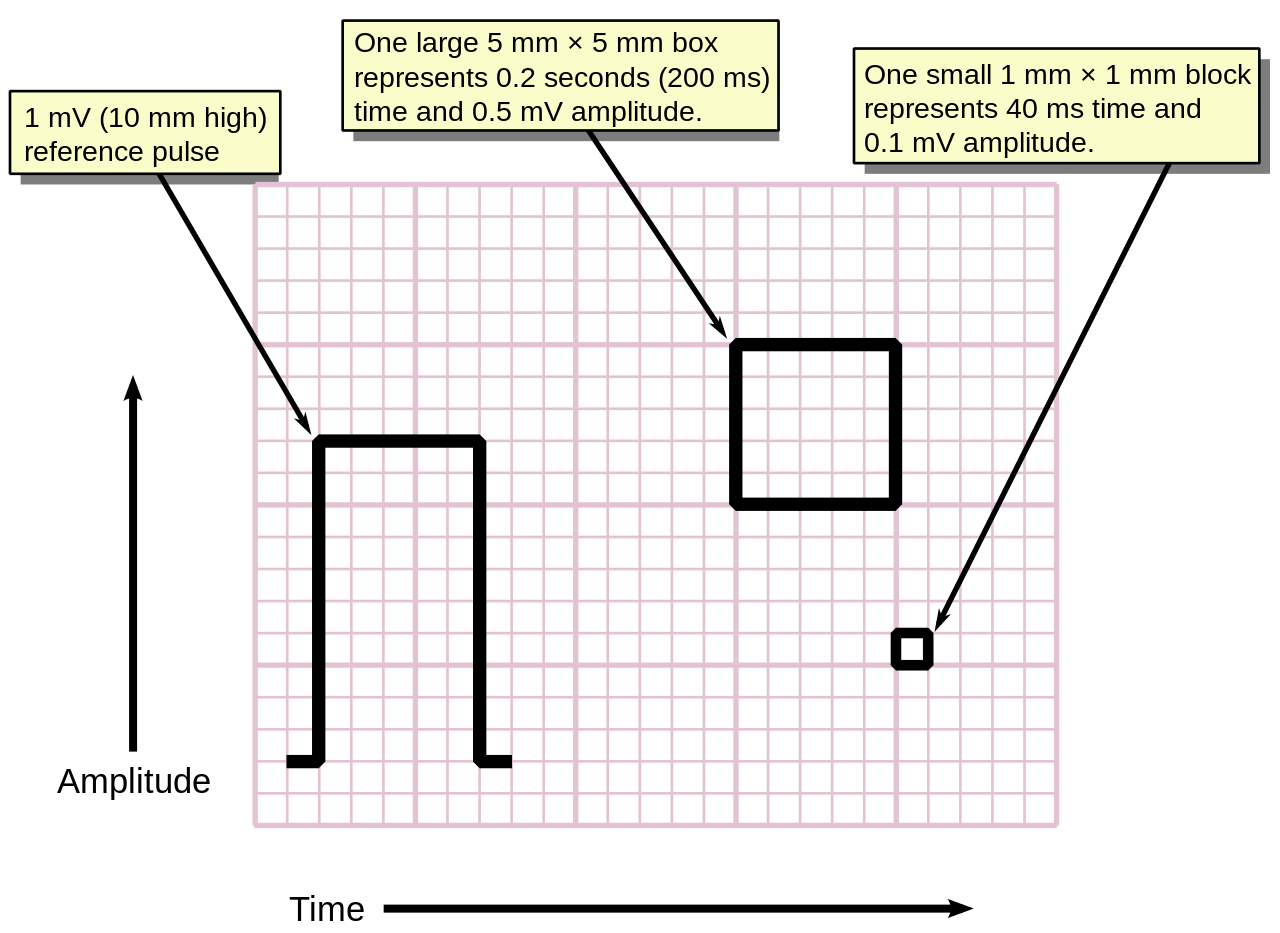
Voltage Standardization
- A full standard calibration mark appears as two vertical lines at the beginning or end of a lead, measuring 1 mV in amplitude or 10 mm tall (or two large squares). It looks like 3/4 of a vertical rectangle traced on the paper that helps verify proper voltage scaling of the EKG.
- A half standard calibration mark (not pictured) is 0.5 mV in amplitude or 5 mm tall. Reduced voltage scaling, like 5 mm/mV, may be used if QRS complexes are extremely large.
- Always check the calibration marks to confirm proper voltage standardization before interpreting EKG amplitudes. Abnormal calibration can lead to misdiagnosis of conditions, such as low voltage or left ventricular hypertrophy.
Rhythm
- Regular sinus rhythm
- P waves present and upright in leads I, II, aVF, and V4 – V6
- P waves inverted in lead aVR
Rate
- Normal range: 60 – 100 bpm
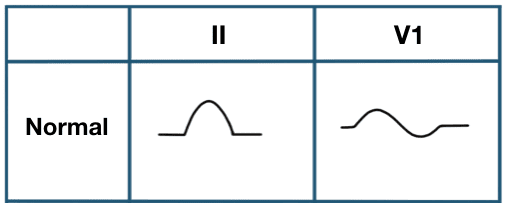
P wave
- Smooth, rounded shape
- Monophasic in lead II
- Biphasic in V1
- Duration: <0.12 secs
- Amplitude: <2.5 mm
PR interval
- Normal range: 0.12 – 0.20 secs
QRS complex
- Duration: <0.12 secs
- Narrow and sharp appearance
- Amplitude greater than P wave
ST segment
- Isoelectric (flat) baseline
- No elevation or depression
- Usually horizontal or upsloping in all leads
T wave
- Upright and symmetric in most leads, except aVR and V1
- Amplitude: <5 mm in limb leads (i.e., leads I, II, III, aVR, aVL, aVF)
- Typically deflects same direction as QRS complex
- Note. Changes in T wave morphology can indicate various benign or pathologic myocardial conditions
QT interval
- Corrected QT interval (QTc): <0.44 secs in men or <0.46 secs in women
- A normal QT is less than half the preceding R-R interval
Electrical axis
- Normal QRS axis is between –30º and 90º
Voltage
- Normal R wave progression from V1 to V6
- No abnormally tall or deep waves across all leads
Intervals and segments
- Consistent PR, QRS, and QT intervals across all leads
Steps to Interpret 12-Lead EKGs
1. Is the rhythm regular or irregular?
-
- Determine if the rhythm is regular or irregular by examining the consistency of the R-R intervals
- Look for patterns that might indicate atrial fibrillation, atrial flutter, or other arrhythmias
2. Measure the heart rate
-
- Use the rapid estimation or 1500 method for regular rhythms
- For irregular rhythms, calculate the heart rate range between the shortest and longest R-R intervals using the 1500 method
3. Evaluate the P waves
-
- Check if there is a P wave before each QRS complex, indicating atrial depolarization
- Assess the morphology and consistency of P waves across different leads
4. Examine the PR interval
-
- Measure the PR interval from the beginning of the P wave to the start of the QRS complex
- Deviations from the normal PR interval may indicate AV block or pre-excitation
5. Assess QRS duration
-
- Measure the width of the QRS complex
- Prolonged QRS duration may suggest a bundle branch block or that the rhythm is of ventricular origin
6. Identify extra or early beats
-
- Look for premature atrial contractions (PACs), premature junctional contractions (PJCs), or premature ventricular contractions (PVCs)
- Note any patterns, such as bigeminy or trigeminy, which could indicate underlying issues
7. Check R wave progression
-
- Ensure normal R wave progression in the precordial leads (V1–V6), with increasing amplitude from V1 to V4
- Poor R wave progression may suggest anterior myocardial infarction or other pathologies
8. Evaluate ST segments
-
- Examine ST segments for depression or elevation, which can indicate ischemia or infarction
- Compare ST segment to isoelectric baseline or TP interval line to determine the extent and significance of deviations
9. Look for abnormal Q waves
-
- Identify any Q waves that are deeper than 25% of the height of the R wave and are wider than 0.04 secs
- Abnormal Q waves may signify previous myocardial infarction if present in a set of contiguous leads (e.g., lateral leads: I, aVL, V5, V6)
10. Assess T waves
-
- Check the size and shape of T waves; they should be upright in most leads and symmetrical
- Inverted or peaked T waves can indicate ischemia, hyperkalemia, or other conditions
11. Identify U waves
-
- Look for U waves following the T wave, most visible in leads V2 and V3
- Prominent U waves may indicate hypokalemia or other electrolyte imbalances
12. Detect myocardial ischemia or infarct
-
- Look for signs of ischemia (i.e., ST depression) or infarction (i.e., ST elevation)
- Correlate findings with clinical presentation and history for accurate diagnosis
13. Summarize findings and name the EKG
-
- Integrate all observations to name the EKG, considering rhythm, rate, intervals, and any abnormalities
- Provide a concise interpretation that includes potential diagnoses and recommendations for further evaluation
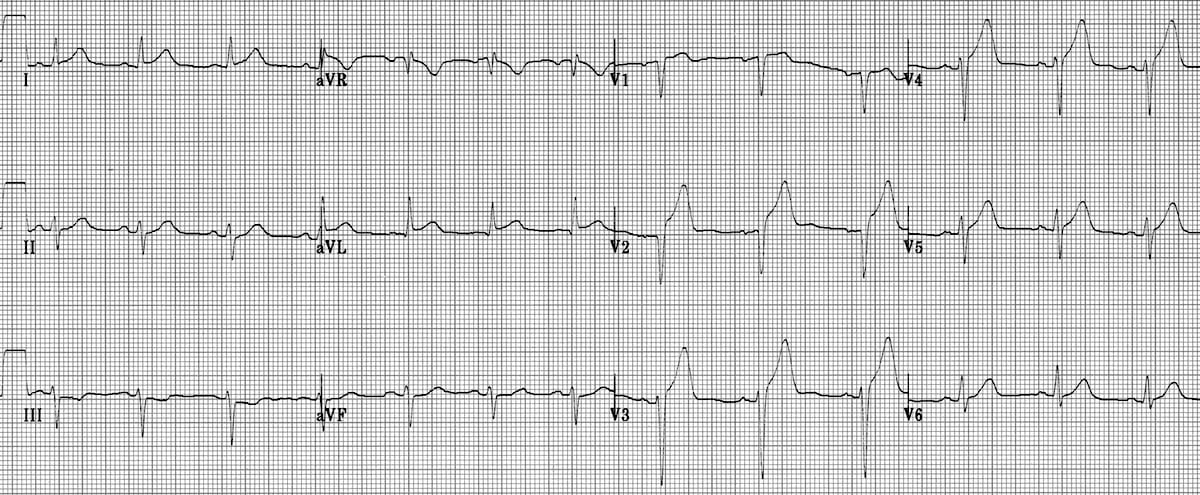
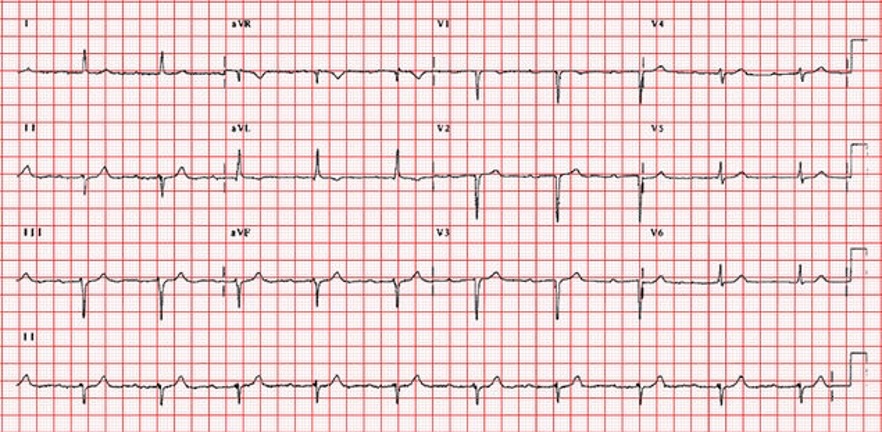
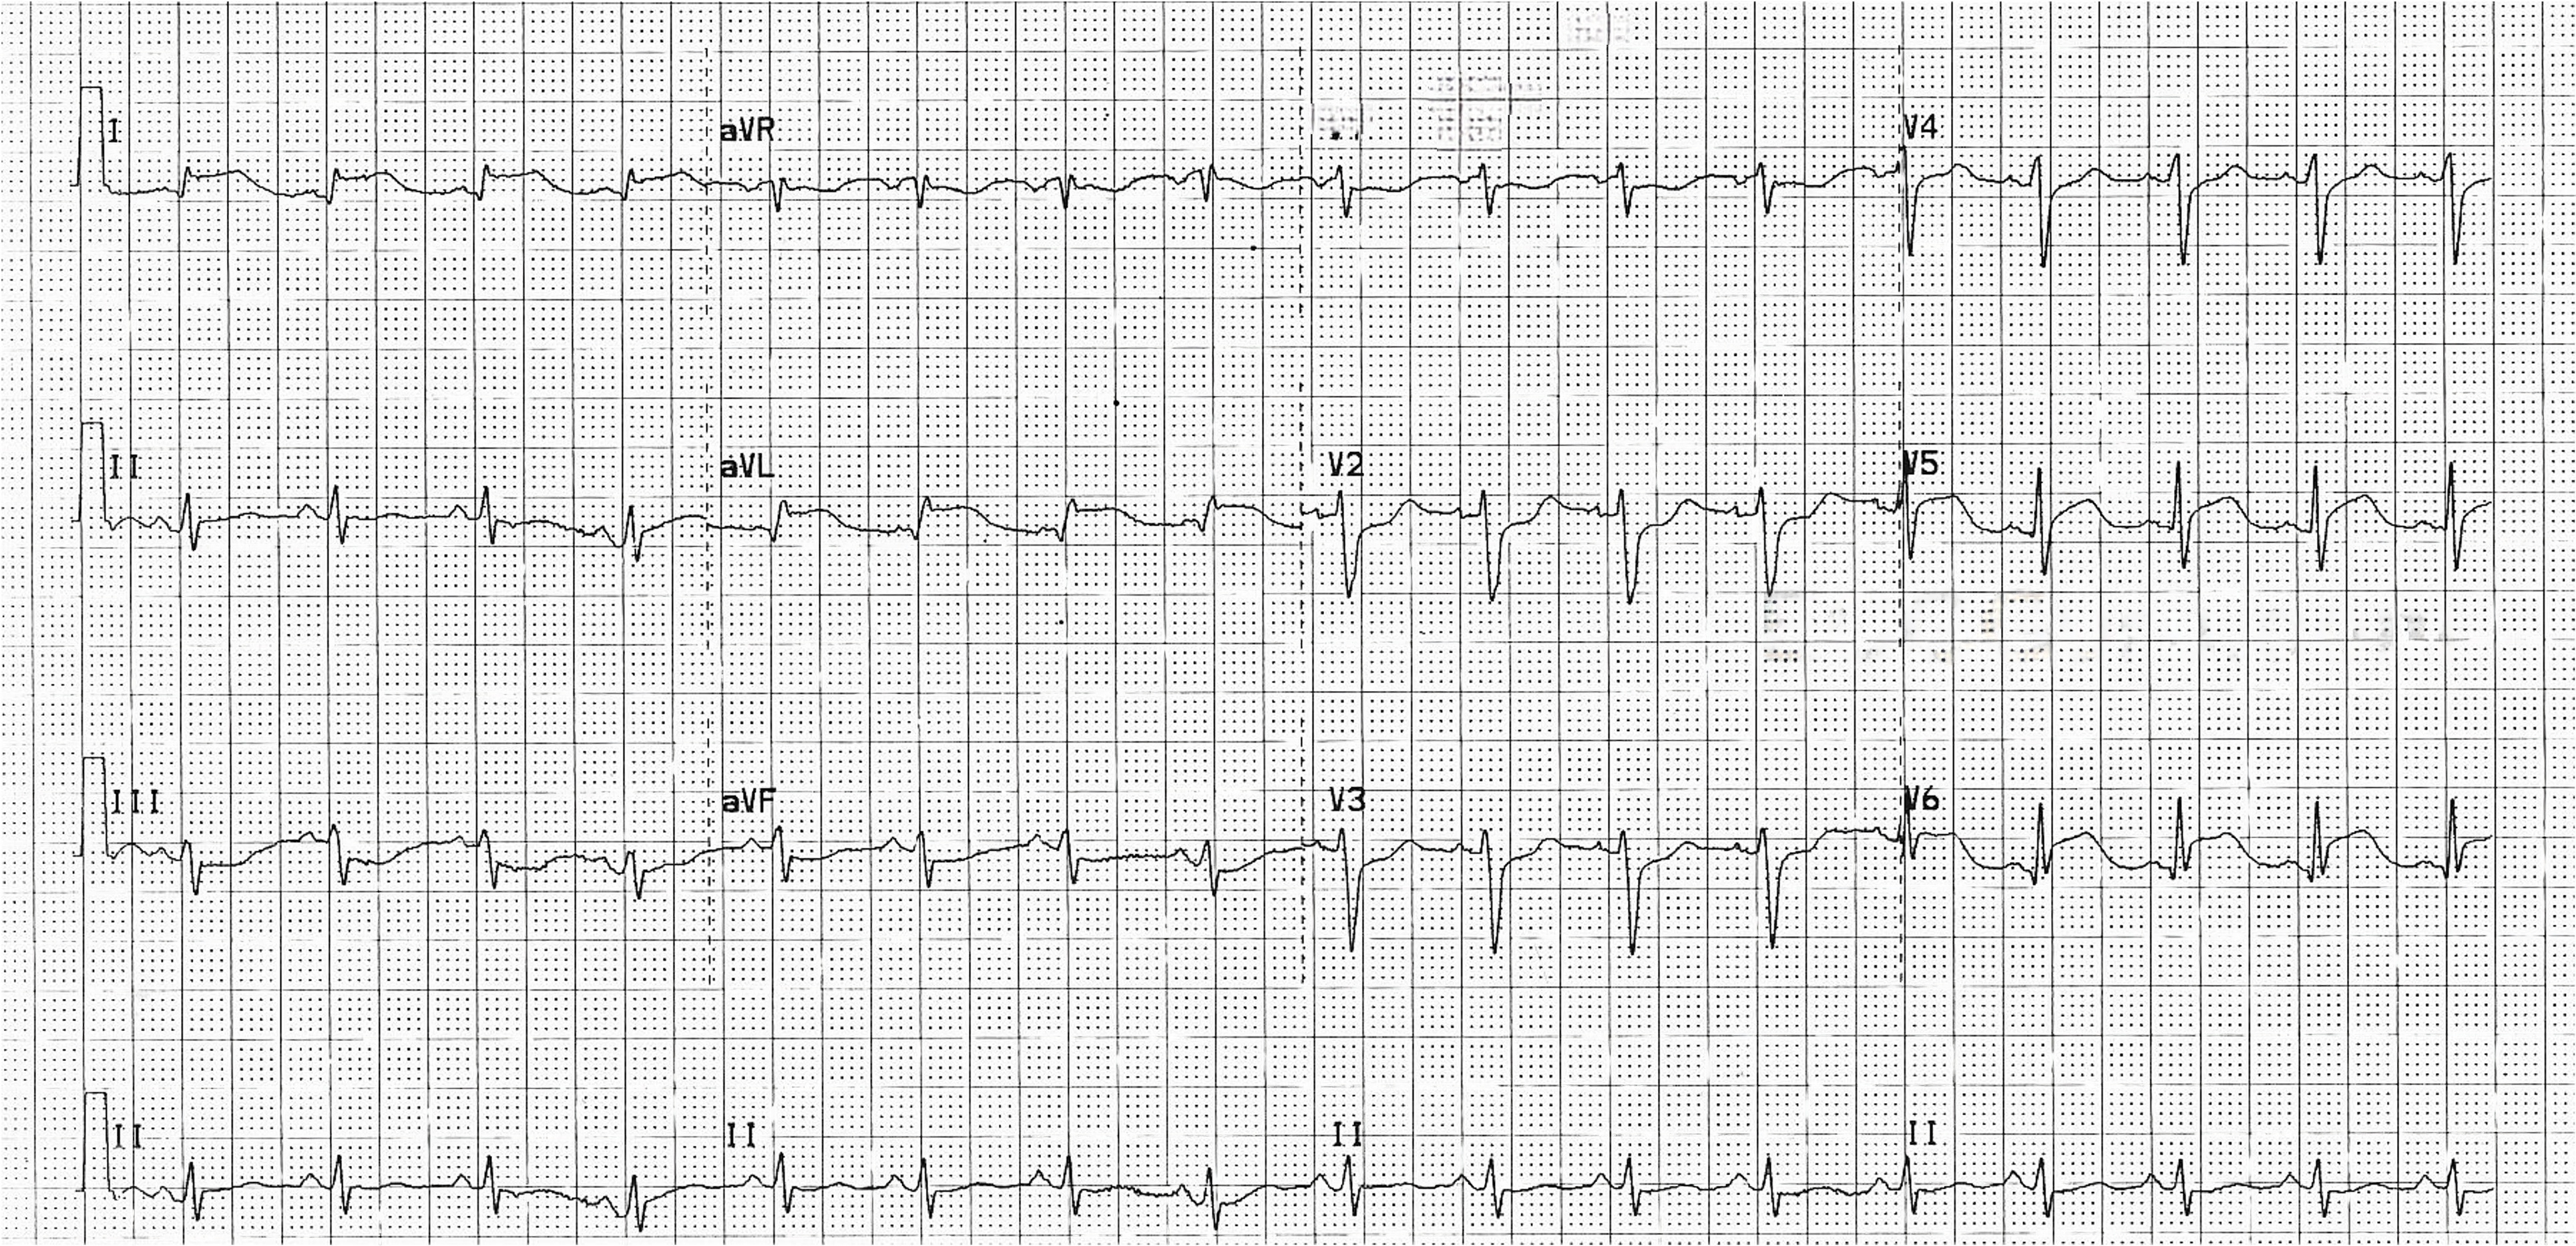
Image Attributions:
Fig. 9.1 – This work, “ECG Paper v2“, is adapted from “ECG Paper” by MoodyGroove, and the image is dedicated to the public domain under CC0 1.0. “ECG Paper v2” by Markus Kuhn is also dedicated to the public domain under CC0 1.0
Fig. 9.2 – “P-wave-morphology-LAE-RAE-BAE-Wagner-2007” by Mike Cadogan and Robert Buttner is licensed under CC BY-NC-SA 4.0 / Cropped from original
Fig. 9.3 – “Nsr (CardioNetworks ECGpedia)” by CardioNetworks is licensed under CC BY-SA 3.0
Fig. 9.4 – “ECG-Anterolateral-AMI-STEMI-2.jpg” by Ed Burns and Robert Buttner is licensed under CC BY-NC-SA 4.0
Fig. 9.5 – “McGill Case 362” by ECGpedia is licensed under CC BY-NC-SA 4.0 / Cropped from original
Fig. 9.6 – “LatMI 100” by Dawn is licensed under CC BY-NC-SA 4.0 / Cropped from original, removed ecguru.com logo

.jpg)