1 Basic Cardiac Concepts
Cardiac Anatomy
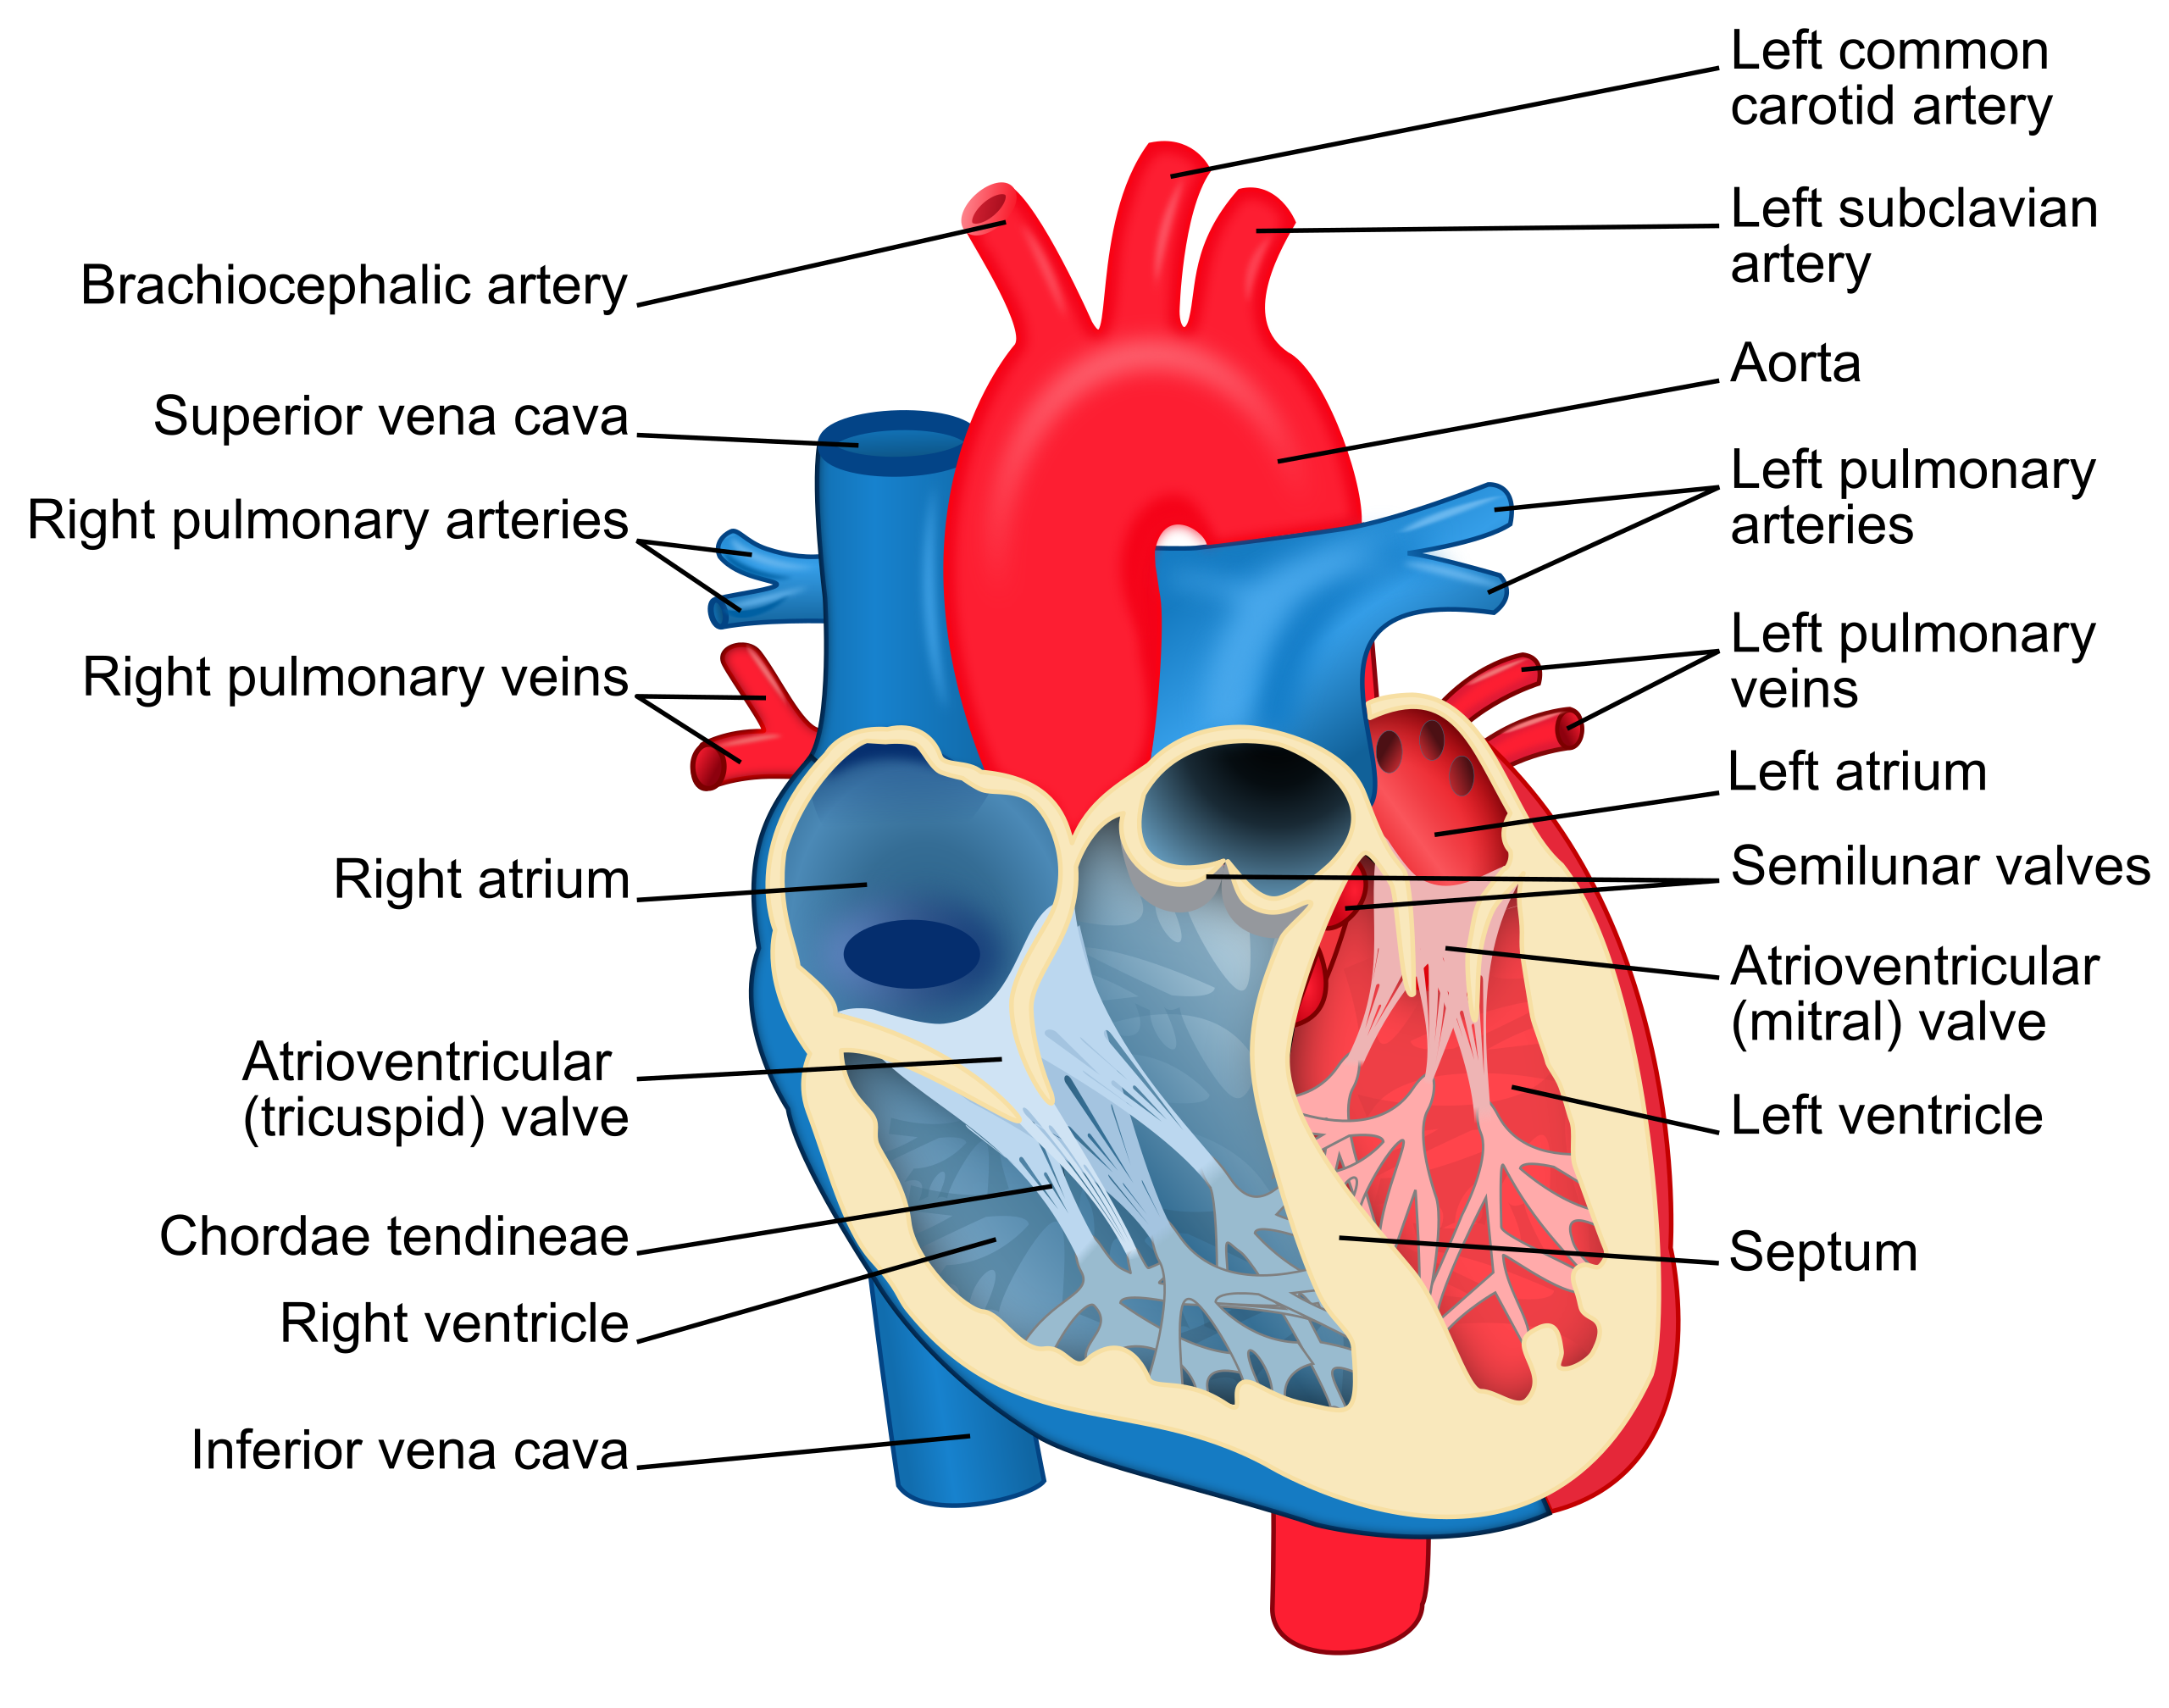
Before interpreting cardiac rhythms, it is vital to understand the anatomy and physiology of the heart. Let us begin with a basic review of the cardiovascular system. The heart is a fist-sized organ that pumps blood throughout the body. It is the primary organ of the circulatory system. The heart contains four main chambers made of muscle and powered by electrical impulses. The brain and nervous system direct the heart’s function. The electrophysiology of the heart will determine the rate and rhythm. The blood pressure is maintained by the contractility of the heart muscle. See Figure 1.1 for an illustration of the heart.
The parts of the heart are similar to the parts of a house. Both the heart and a house have the following components[1]:
- Walls
- Chambers (the rooms)
- Valves (the doors)
- Blood vessels (the plumbing)
- Electrical conduction system (the electricity)
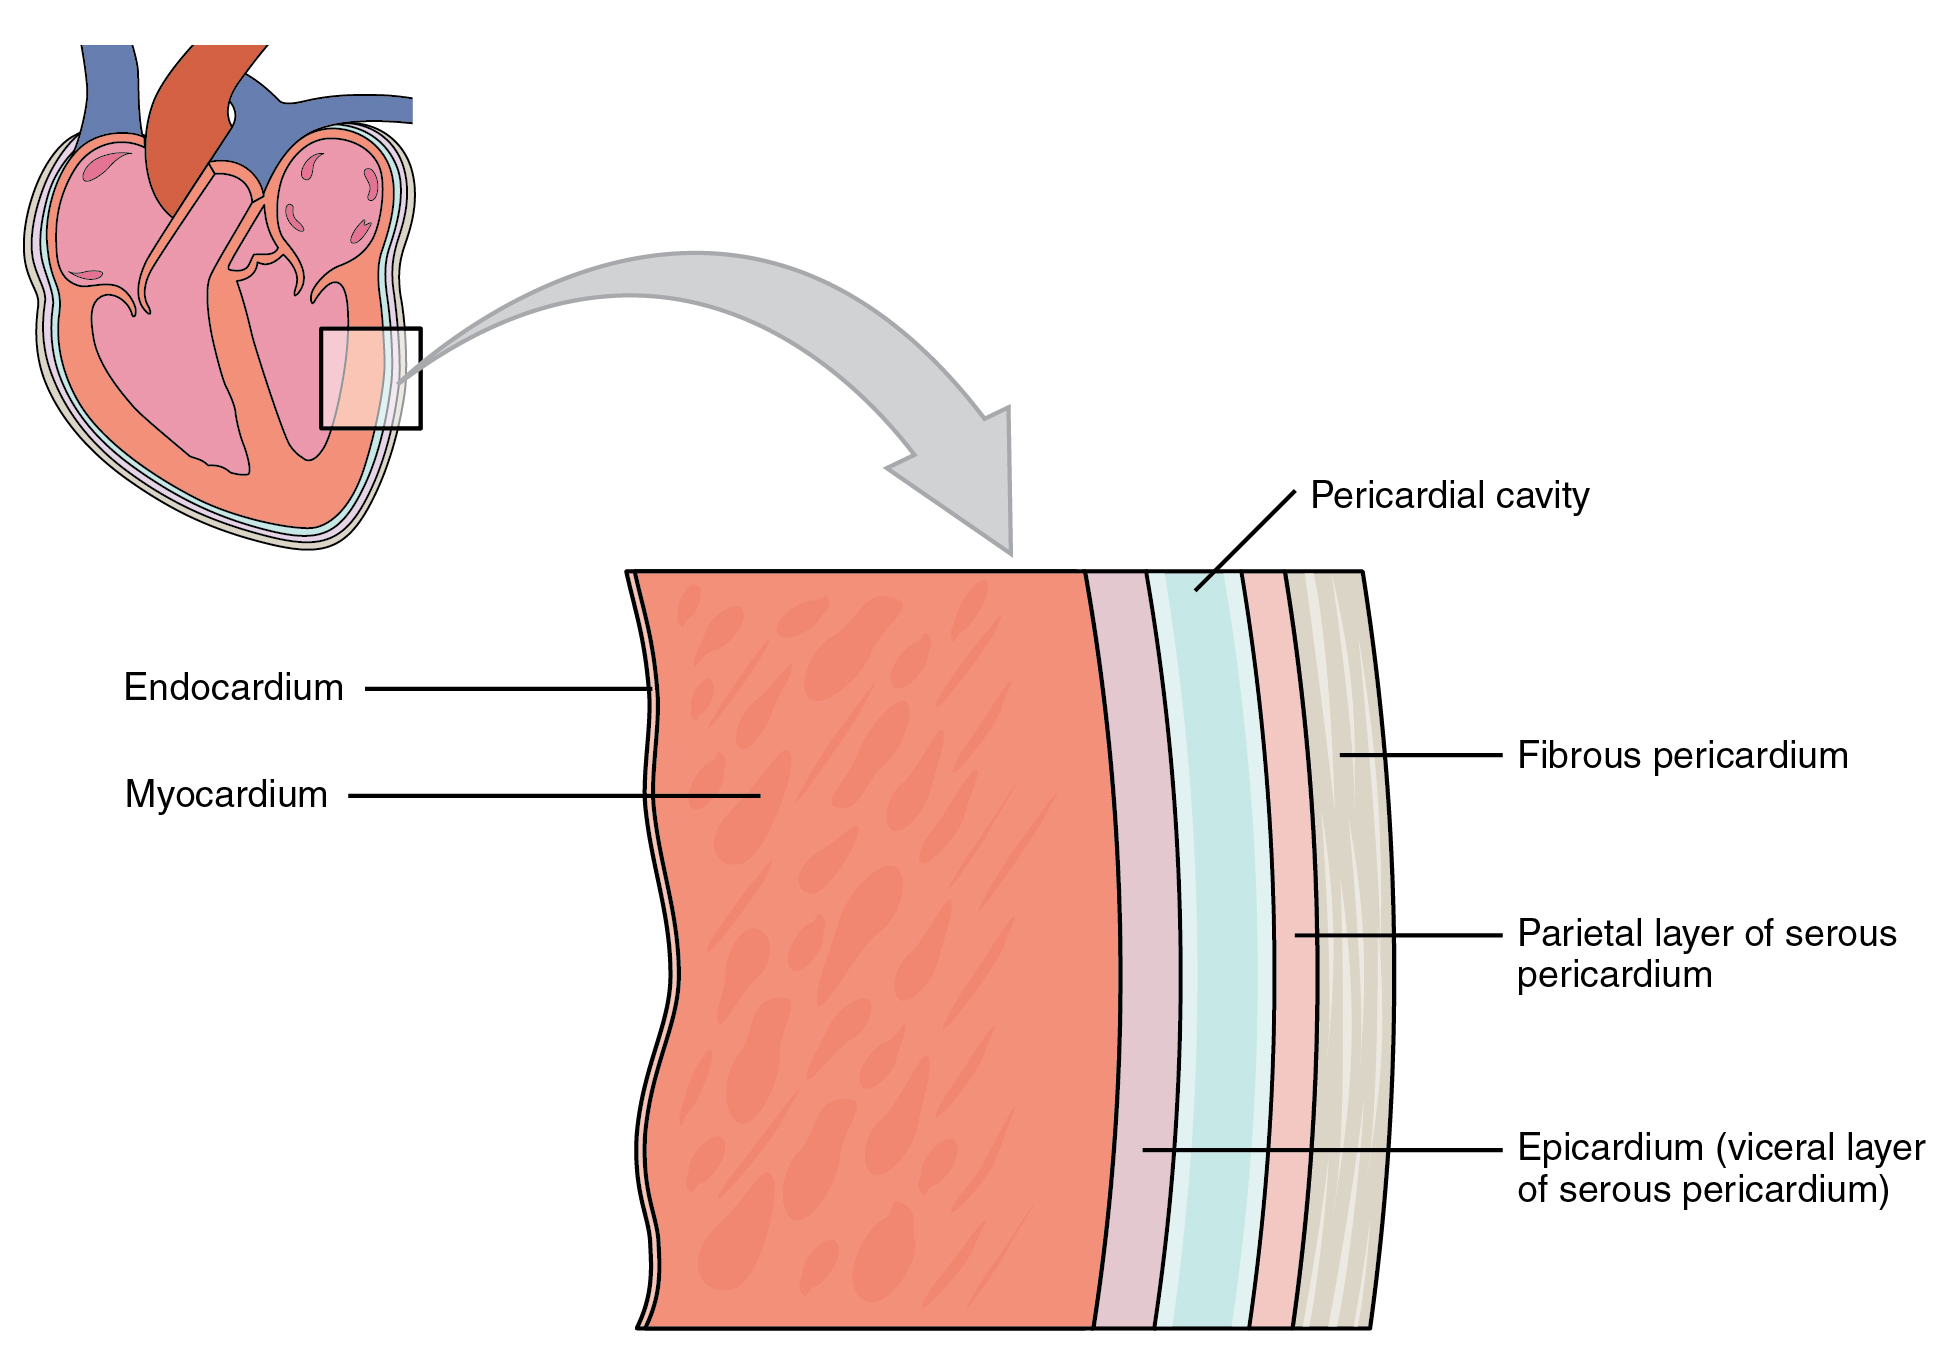
Heart walls are muscles that contract (squeeze) and relax to send blood throughout the body. A layer of muscular tissue called the septum divides the heart walls into the left and right sides. Heart walls have three layers:
- Endocardium: The inner layer
- Myocardium: The muscular middle layer
- Epicardium: The protective outer layer
The epicardium is one layer of the pericardium. The pericardium is a protective sac that covers the entire heart. It produces fluid to lubricate the heart and keeps it from rubbing against other organs.
The heart is divided into four chambers. There are two chambers on the top (called the left and right atria) and two chambers on the bottom (called the left and right ventricles). Blood flows through the chambers of the heart in the following order:
- Right atrium: Two large veins called the superior vena cava and the inferior vena cava deliver oxygen-poor blood to the upper right chamber of the heart called the right atrium. The superior vena cava carries deoxygenated blood from the upper body. The inferior vena cava carries deoxygenated blood from the lower body. The right atrium pumps this blood through the tricuspid valve into the right ventricle.
- Right ventricle: This lower right chamber of the heart pumps the oxygen-poor blood through the pulmonary valve into the pulmonary arteries to enter the lungs. (Note that arteries usually carry oxygenated blood, but pulmonary arteries carry deoxygenated blood to the lungs.) The lungs reload blood with oxygen while removing carbon dioxide, and the pulmonary veins carry oxygenated blood back to the heart into the left atrium. (Note that veins usually carry deoxygenated blood, but pulmonary veins are the only veins in an adult that carry oxygenated blood.)
- Left atrium: The upper left chamber of the heart receives the oxygenated blood and pumps it through the mitral valve into the left ventricle.
- Left ventricle: The lower left chamber of the heart is slightly larger than the right ventricle because it pumps oxygen-rich blood through the aortic valve to the coronary arteries and out to the rest of the body via the aorta. See Figure 1.3 for an illustration of blood flow through the heart.
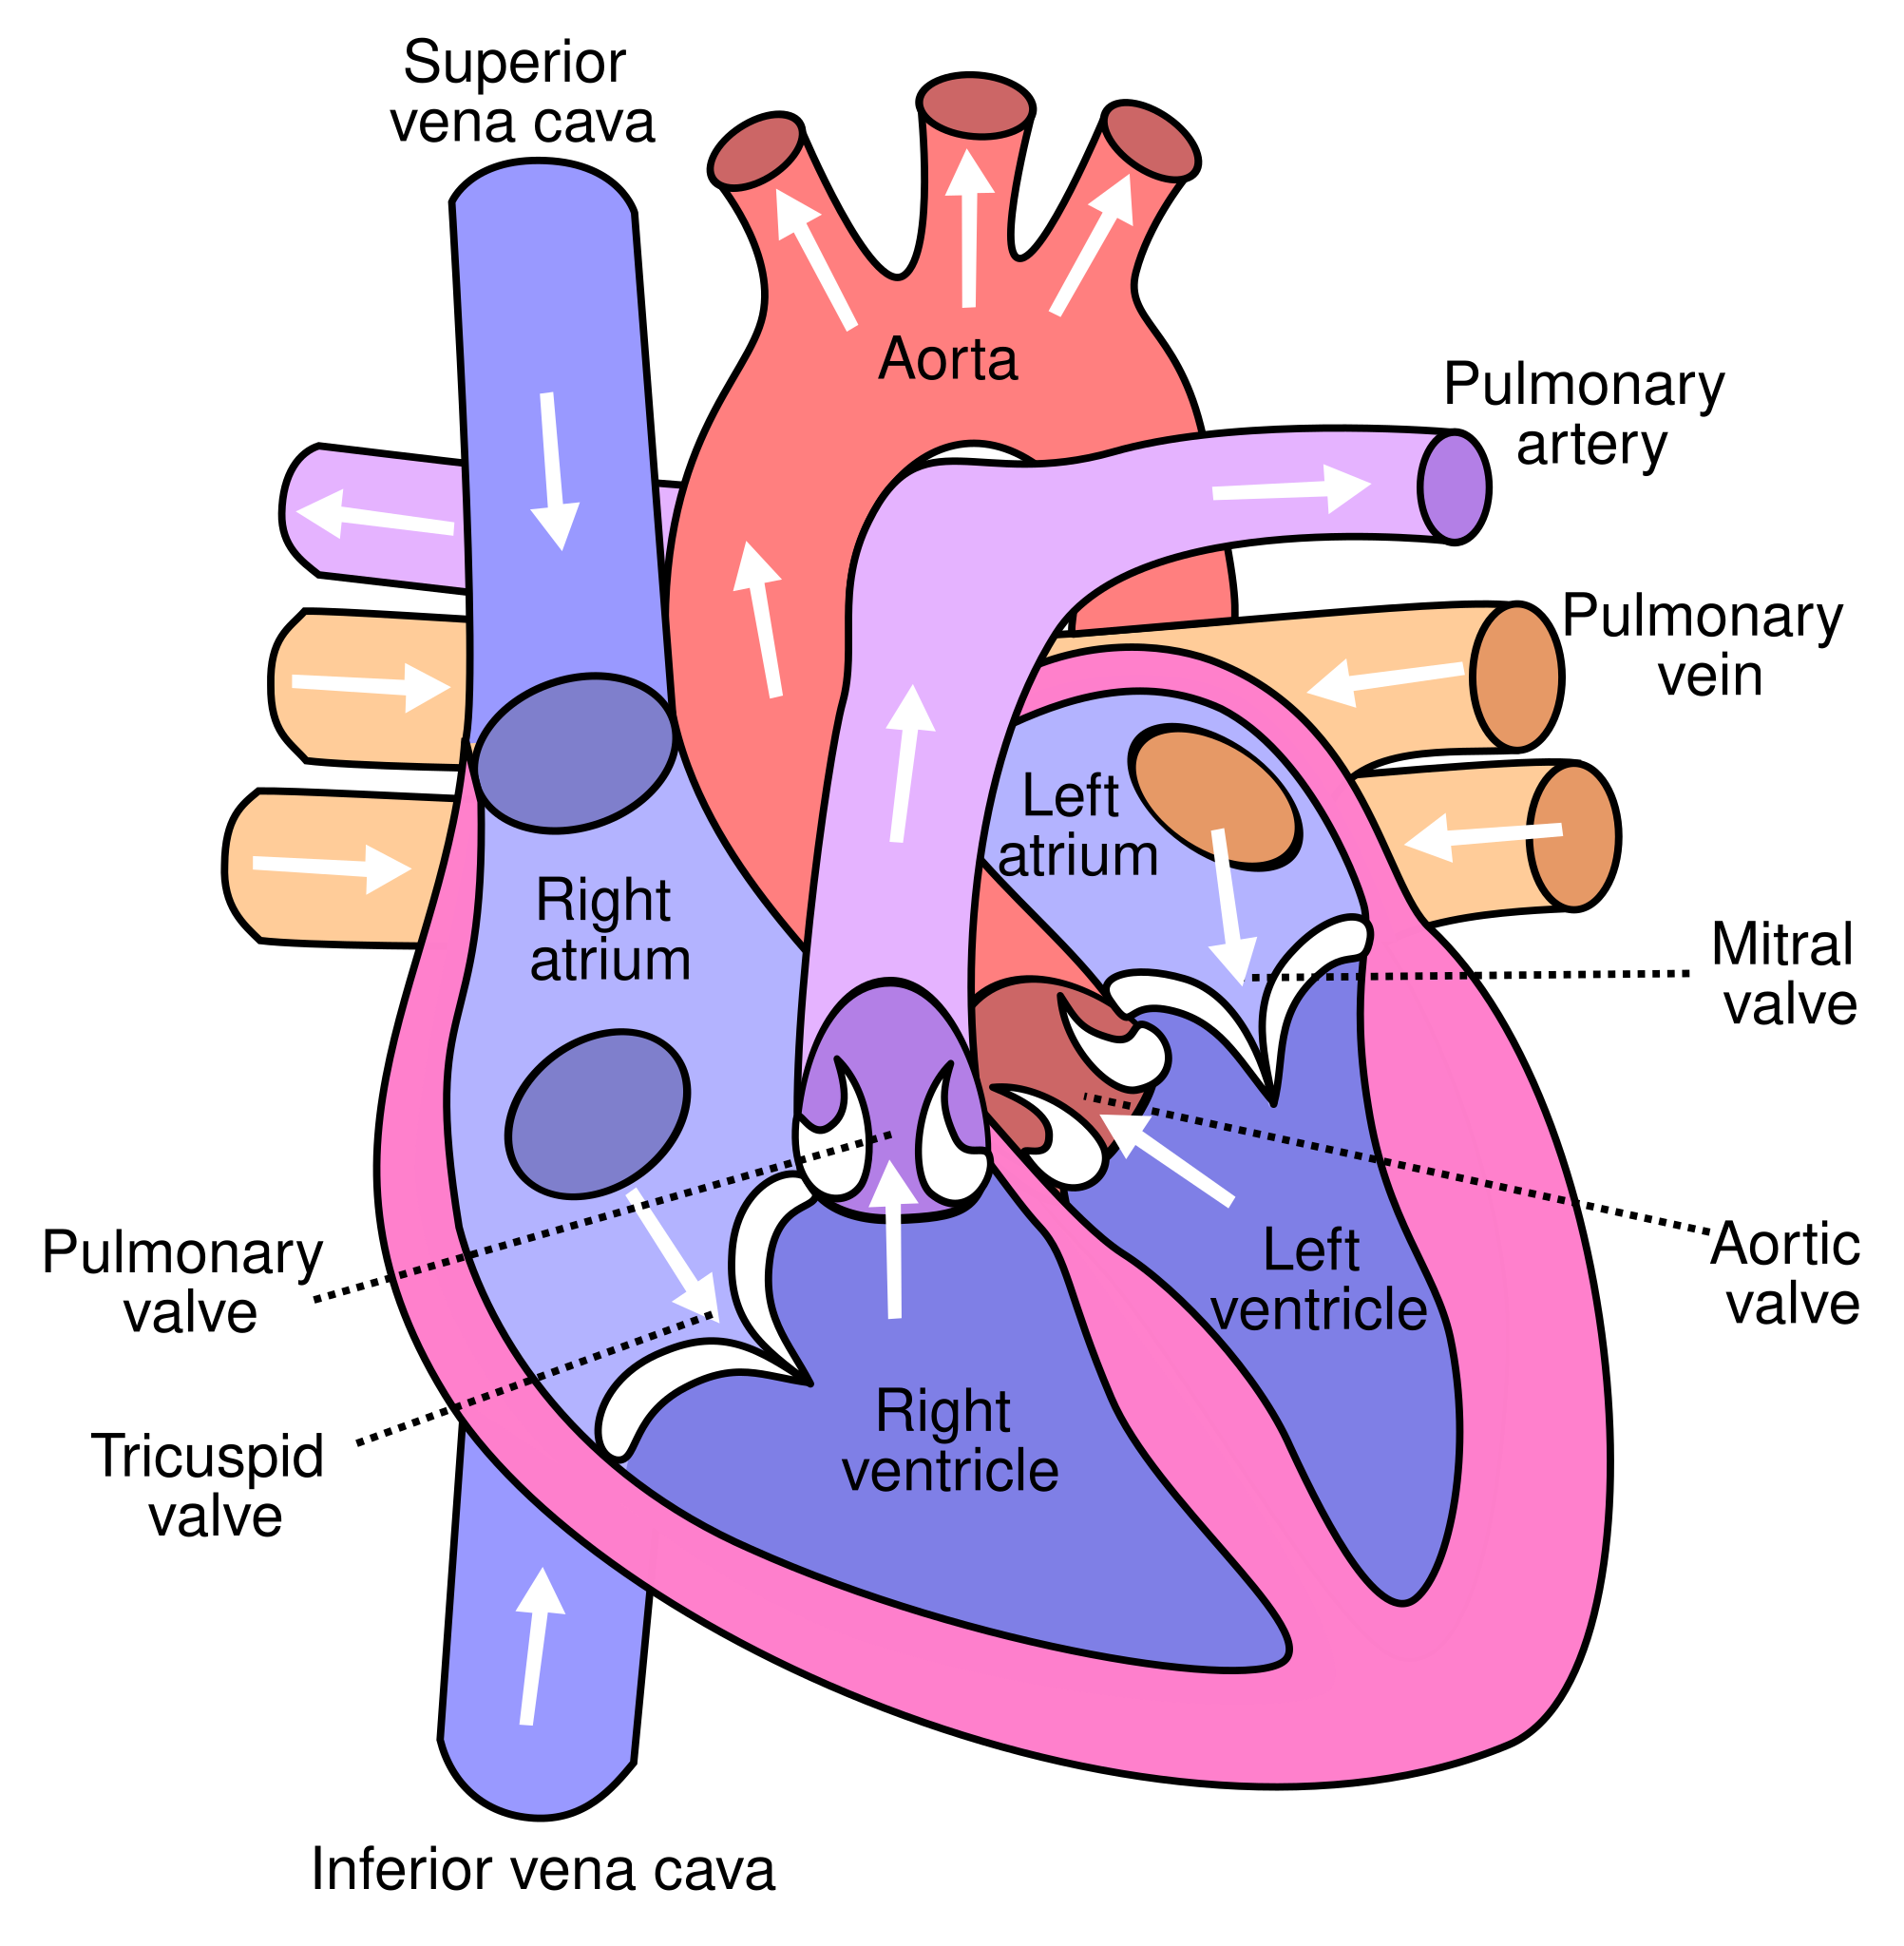
The heart valves are like doors between the four heart chambers that open and close to allow blood to flow through while preventing blood from moving backwards through the heart. The atrioventricular (AV) valves open between the atria and the ventricles (i.e., the upper and lower chambers of the heart). There are two AV valves:
- Tricuspid valve: The valve between the right atrium and right ventricle
- Mitral valve: The valve between the left atrium and left ventricle
Semilunar valves open when blood flows out of the ventricles. Semilunar valves include the following:
- Pulmonary valve: The valve that opens when blood flows from the right ventricle into the pulmonary arteries
- Aortic valve: The valve that opens when blood flows out of the left ventricle to the aorta
The heart pumps blood through three types of blood vessels called arteries, veins, and capillaries:
- Arteries carry oxygen-rich blood from the heart to the body’s tissues. (As previously noted, the exception is the pulmonary arteries that carry deoxygenated blood to the lungs.) The aorta is a large artery that carries oxygen-rich blood from the heart to the rest of the body. The heart itself receives oxygen and nutrients through a network of coronary arteries that run along the heart’s surface.
- Veins carry oxygen-poor blood back to the heart. (As previously noted, the exception is the pulmonary veins that carry oxygenated blood from the lungs to the heart.)
- Capillaries are small blood vessels where the body exchanges oxygen and carbon dioxide in the blood at the cellular level.
Cardiac Electrical Conduction System
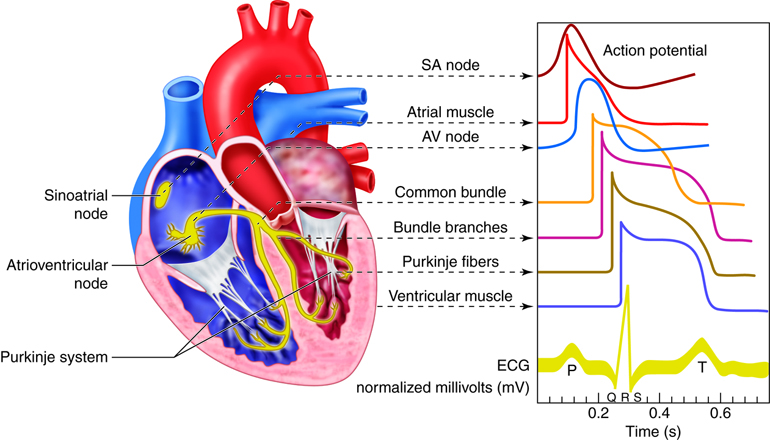
The electrical conduction system of the heart is similar to the electrical wiring of a house. The heart has a network of electrical bundles and fibers that control the rhythm and pace of the heartbeat. The electrical conduction system includes these components:
- Sinoatrial (SA) node: The SA node is located in the upper portion of the right atrium and is a major element of the conduction system. The SA node is often referred to as the heart’s natural pacemaker. The inherent rate for the SA node to initiate an electrical impulse is 60-100 beats per minute. It is responsible for the signals that make the heart beat with a normal rate and rhythm.
- Atrioventricular (AV) node: The AV node is located in the lower region of the right atrium. The AV node carries electrical signals from the SA node into the septum to reach the ventricles. If the SA node fails to send signals, the AV node takes over responsibility of pacing the heart as the “backup” pacemaker. The AV node will pace the heart at a rate of 40-60 beats per minute.
- Bundle of His: A collection of cardiac cells found along the septum between the ventricles that carries electrical impulses from the AV node to the left and right bundle branches.
- Left bundle branch: Offshoots from the bundle of His that send electrical impulses to the left ventricle.
- Right bundle branch: Offshoots from the bundle of His that send electrical impulses to the right ventricle.
- Purkinje fibers: A network of thin filaments that carry electrical impulses that cause the ventricles to contract and pump blood out of the heart. If all other “backup” pacemakers in the heart fail, the Purkinje fibers will pace the heart at 20-40 beats per minute.
View the following YouTube video explaining the electrical conduction system of the heart:
Electrocardiograms
Electrocardiograms (EKGs) use leads with electrodes attached to the client’s body to record the electrical activity of the heart onto special graph paper or on a cardiac monitor. These electrodes detect the small electrical changes of cardiac muscle depolarization followed by repolarization during each cardiac cycle (heartbeat).
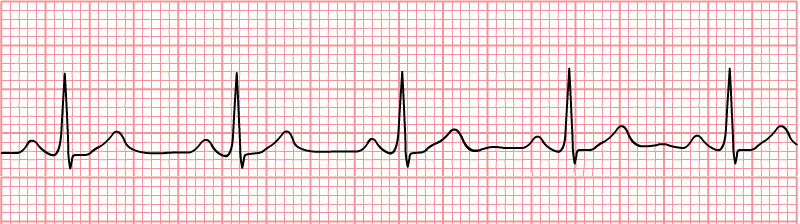
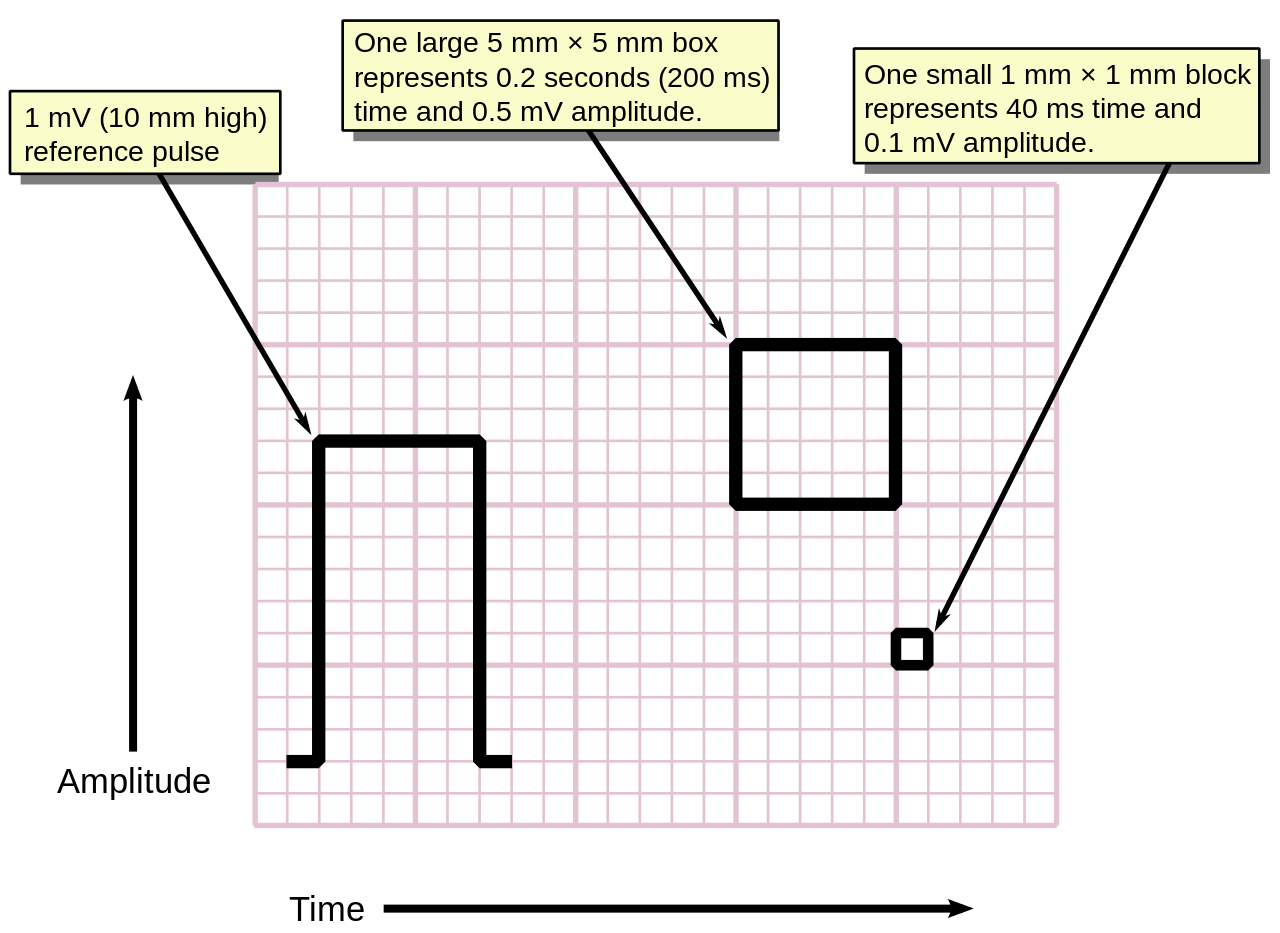
A paper rhythm strip is at least a 6-second tracing printed out on special graph paper that shows activity from one or two leads. See Figure 1.5 for an example of an EKG rhythm strip. When interpreting a paper EKG, the vertical lines indicate voltage of a given waveform. The thin lines, thick lines, and boxes along the horizontal axis represent various amounts of time (see Figure 1.6) as the electrical signal is conducted through the heart tissue:
- Thin lines or small box (1 mm intervals): 0.04 seconds (or 40 ms)
- Thick lines or big box (5 mm intervals): 0.20 seconds (or 200 ms)
12-Lead EKG
A 12-lead electrocardiogram is a diagnostic test that uses ten electrodes to record information through twelve different perspectives of the heart to display a complete picture of its electrical activity. Six electrodes are placed on the surface of the client’s chest (i.e., V1, V2, V3, V4, V5, and V6), and four electrodes are placed bilaterally on their upper and lower extremities (i.e., RA, LA, RL, LL). In this manner, the heart’s electrical activity is measured from twelve different angles, referred to as “leads,” to capture each moment throughout the cardiac cycle.
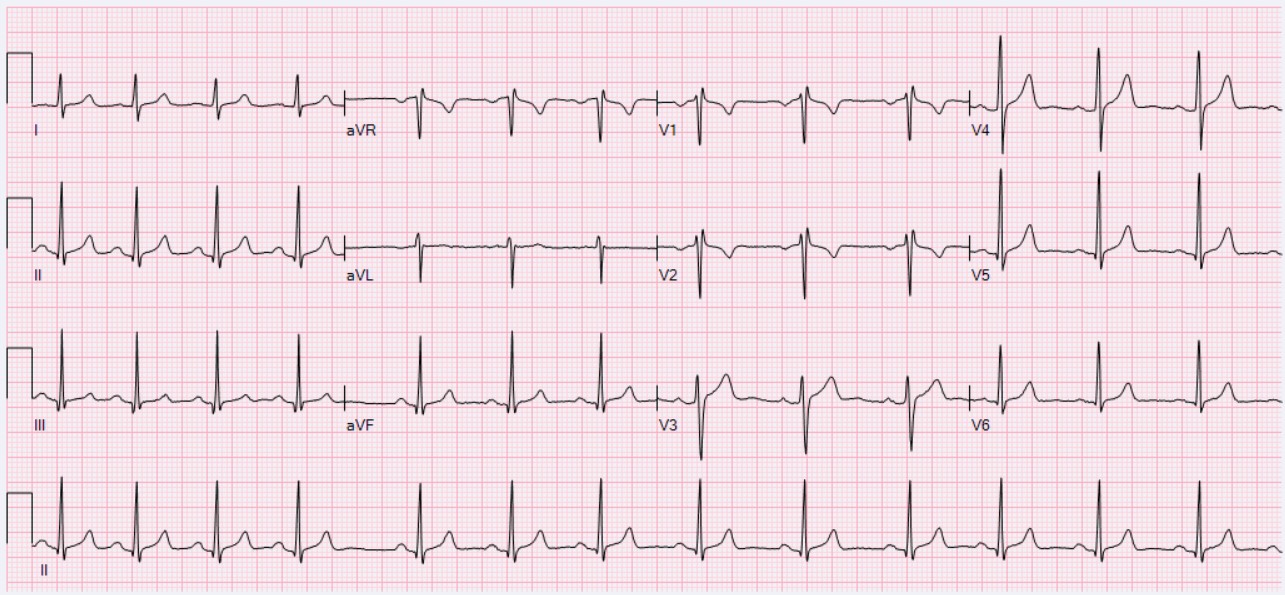
A standard 12-lead EKG report displays a 2.5-second tracing of each of the twelve leads. The tracings are most commonly arranged in a grid of four columns and three rows, however, there are several different layouts that vary from machine settings and the setting in which the EKG is used, such as a hospital or prehospital environment. On any 12-lead EKG printout, it is important to become acquainted with the layout of the leads. As seen in Figure 1.7, the first column of the 12-lead EKG is the limb leads (I, II, and III), the second column is the augmented limb leads (aVR, aVL, and aVF), the last two columns are the precordial leads (V1 to V6), and there is a 10-second rhythm strip of lead II at the bottom of the EKG sheet compared to 2.5 seconds of information across the 12-leads above it. Some printouts may include one or multiple full strips of a certain lead, typically lead II, since it closely aligns with the heart’s natural electrical conduction, providing a clear view of cardiac activity.
Each of the twelve EKG leads record the electrical activity of the heart from a different angle and, therefore, align with different anatomical areas of the heart:
- Inferior leads (II, III, and aVF): View inferior surface of the heart
- Lateral leads (I, aVL, V5, and V6): View lateral wall of the left ventricle
- Anterior leads (V1, V2, V3, and V4): View anterior surface of the heart
- Note. Leads V1 and V2 are sometimes referred to as the septal leads of the heart
When administered and interpreted accurately, an EKG can be used to detect and monitor several types of heart conditions such as dysrhythmias, heart attacks (myocardial infarction), and electrolyte imbalances.
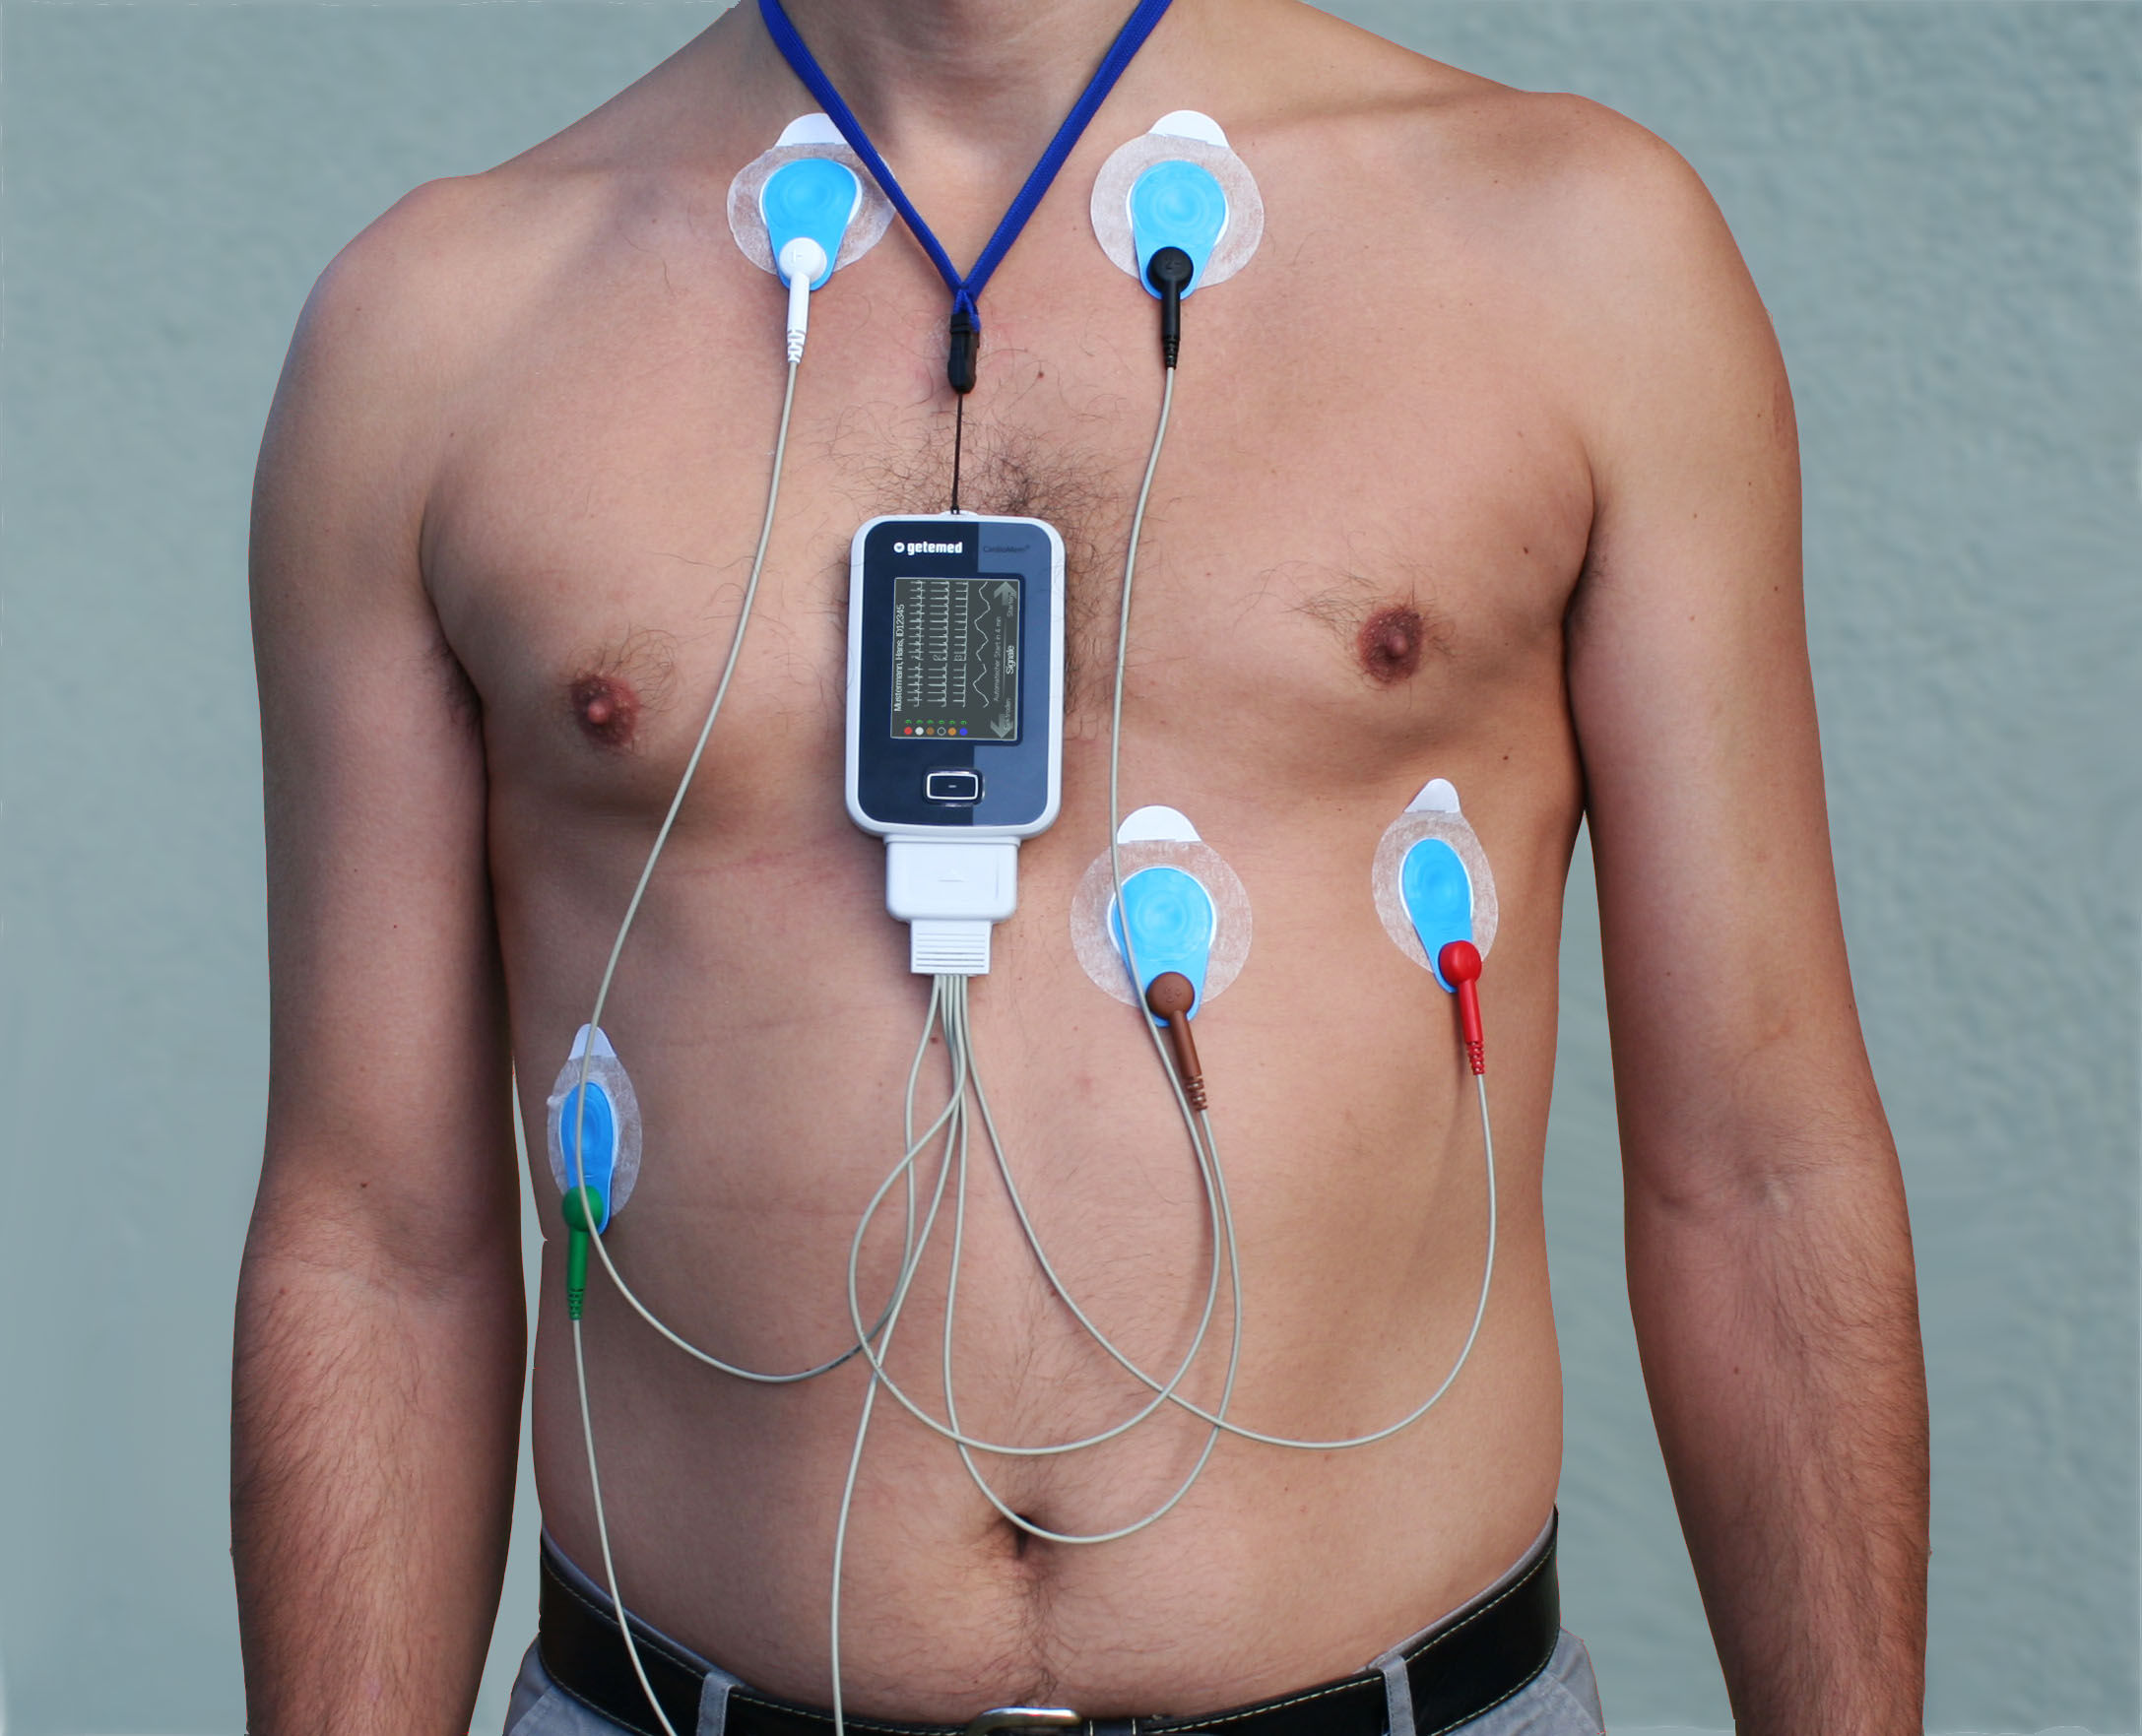
Telemetry
Telemetry refers to a portable device used to continuously monitor a client’s heart rhythm. While a client is on telemetry (also referred to as cardiac monitoring), their heart’s electrical patterns are displayed on a monitor. The patterns are continuously monitored by specially trained technicians and nurses who interpret the heart’s electrical activity.
Arrhythmias
Occasionally, an area of the heart other than the SA node will initiate an impulse that will be followed by a premature contraction. Premature contractions simply mean these impulses happen too soon in the scheme of the heart’s intended rhythm and may originate from a different place than a regular beat. These premature contractions can happen in the atria (premature atrial contraction), ventricles (premature ventricular contraction), or AV junction (premature junctional contractions). Such a contraction is known as an ectopic beat, and the premature contraction causes an irregular heart rate and rhythm during that beat. The underlying heart rate and rhythm can be either regular or irregular. An ectopic focus may be stimulated by localized ischemia, exposure to certain drugs, abnormal electrolytes or acid-base balance, hypoxia, elevated stimulation by both sympathetic or parasympathetic divisions of the autonomic nervous system, or several diseases or pathological conditions. Occasional occurrences of arrhythmias are generally short-lived and not life-threatening. However, if the condition becomes a chronic deviation from the normal pattern of impulse conduction and contraction, it is referred to as dysrhythmia or arrhythmia. Severe arrhythmias can lead to cardiac arrest, which is fatal if not treated within minutes.
Artifact
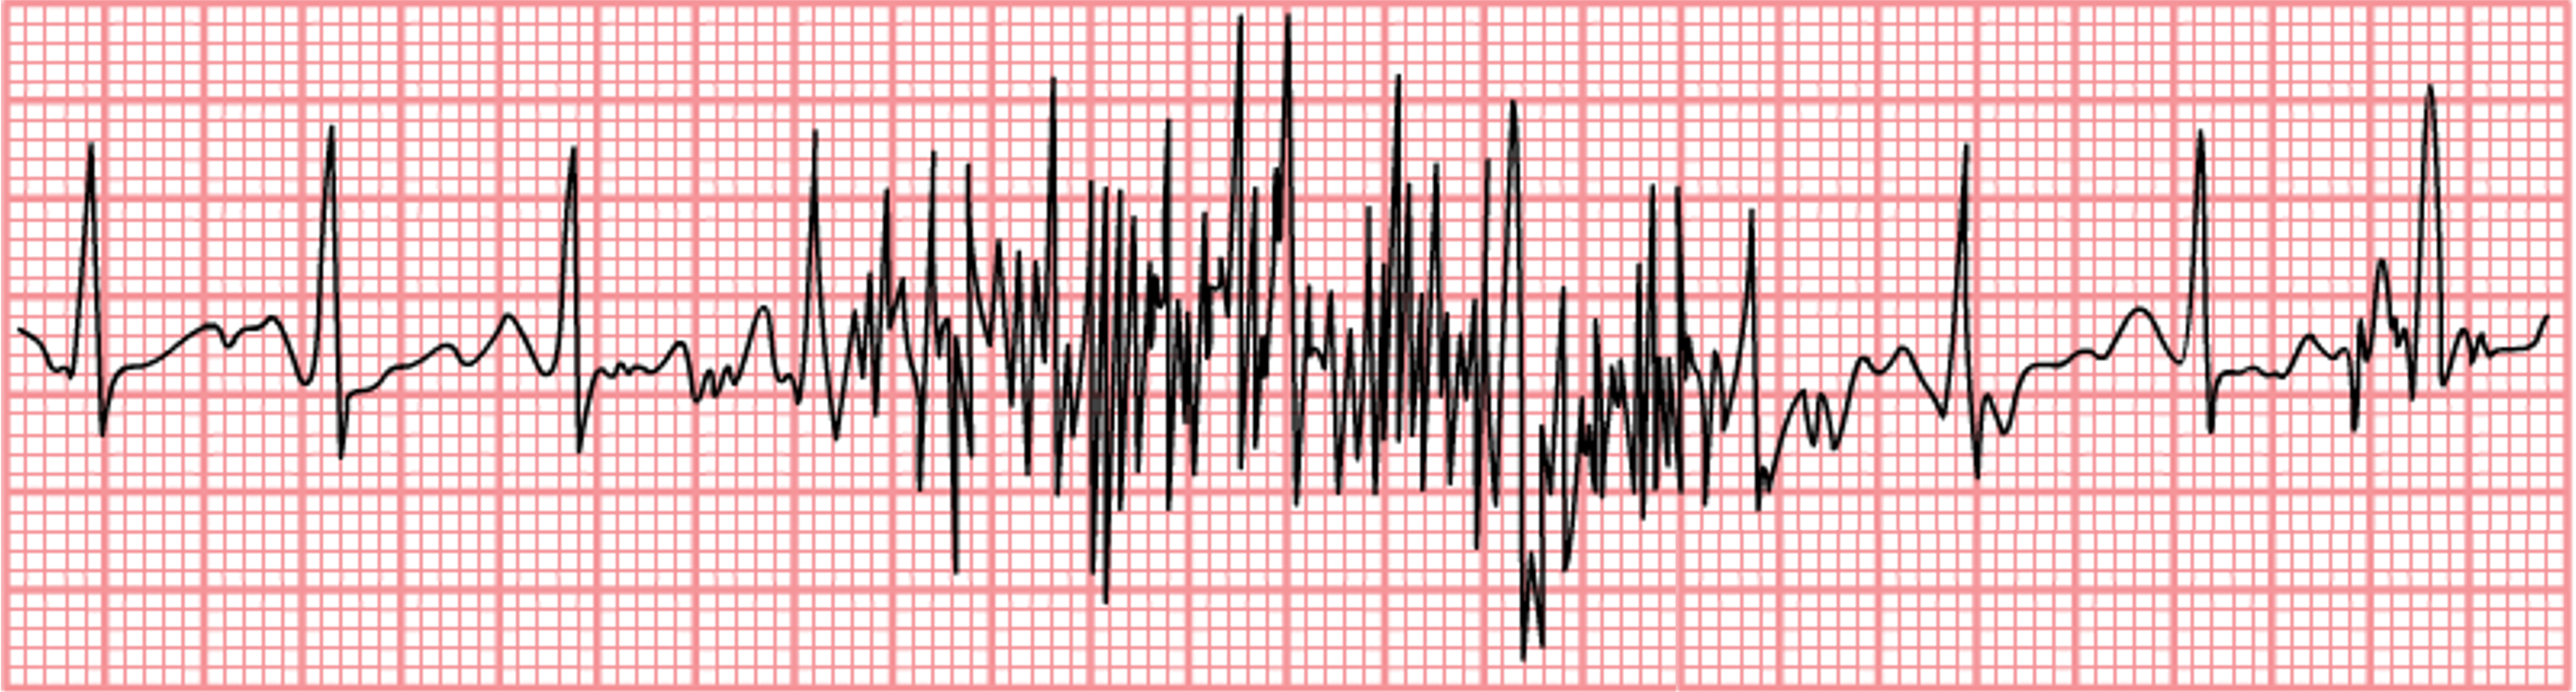
The monitor or EKG strip typically displays the name of the cardiac rhythm the client is experiencing, but this display is not always correct due to artifact. Artifact occurs when the electrodes are not in good contact with the skin and/or if the client moves during the tracing. See an image of artifact on an EKG strip in Figure 1.9. Artifact may be interpreted by the monitor as ventricular beats or other abnormal cardiac patterns when, in reality, there are no cardiac abnormalities occurring. For this reason, it is important to observe the client to ensure that what is displayed on the monitor is accurate according to the client’s condition.
Components of EKG Waveforms
There are five prominent components on an EKG waveform: the P wave; the Q, R, and S components (often referred to as the QRS complex), and the T wave. Each wave represents a specific electrical impulse in the heart with a specific appearance and normal ranges of measurements on the EKG graph paper. See Figure 1.10 for an image of these components.
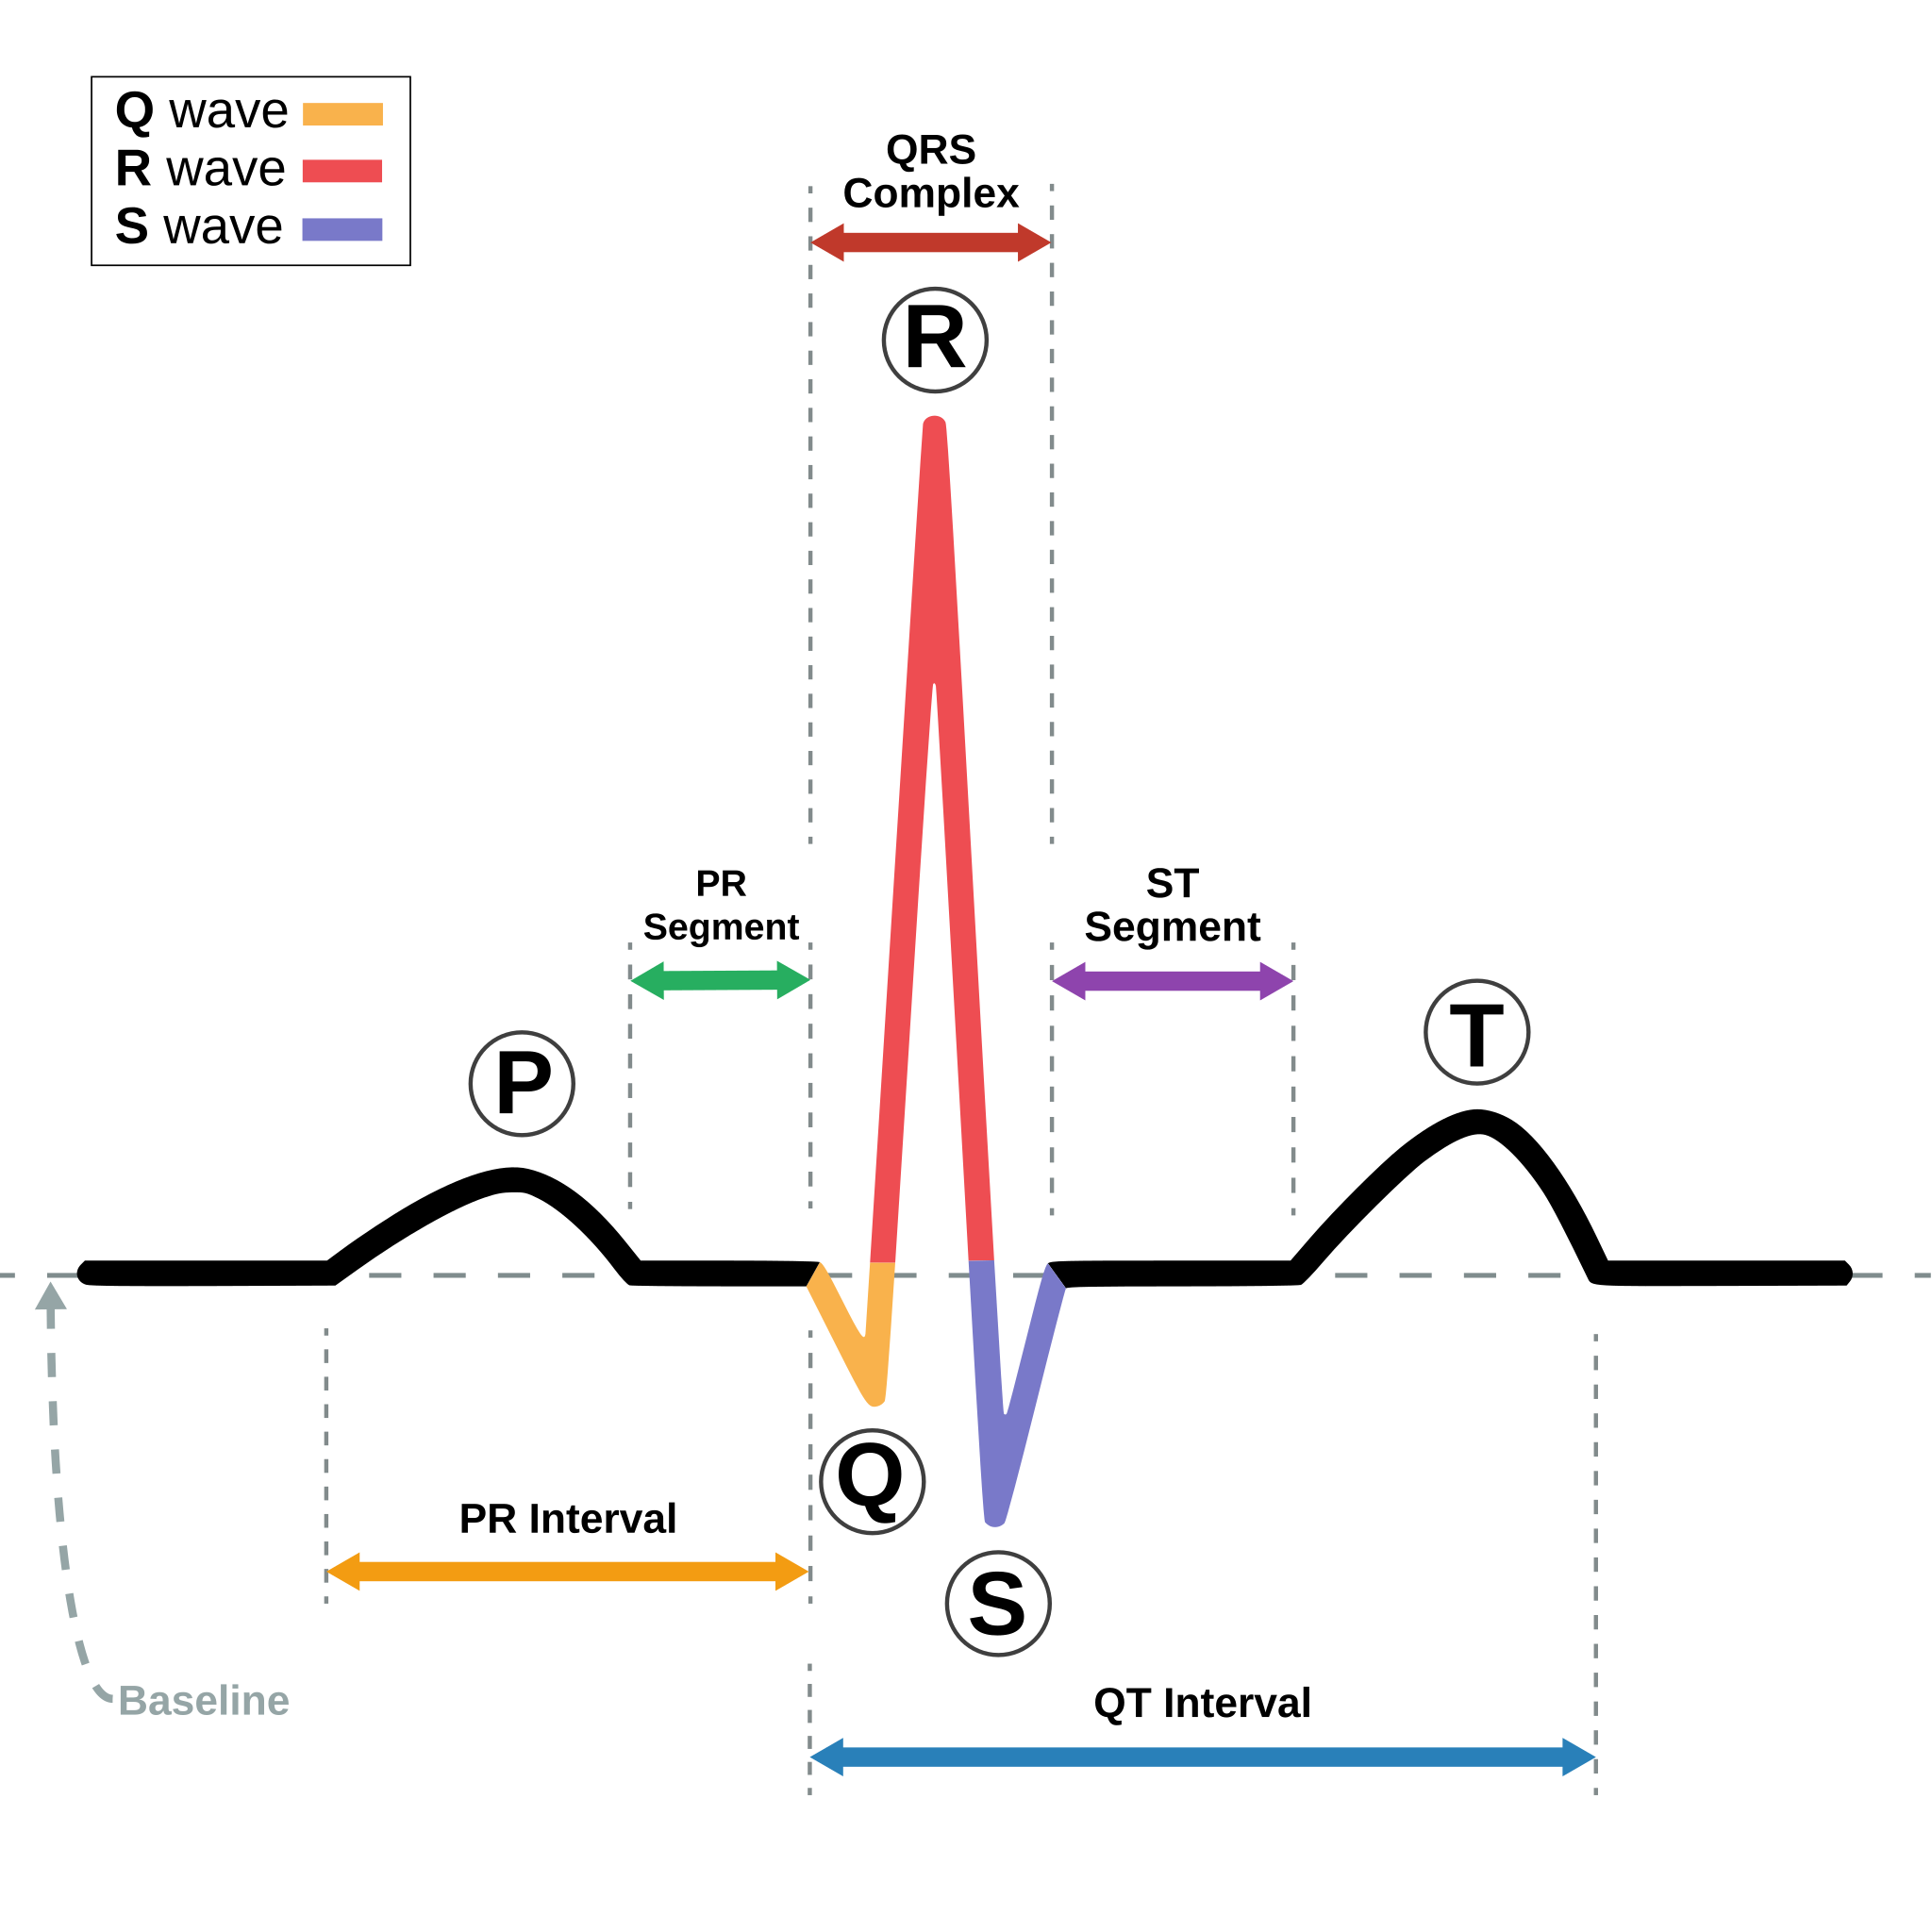
The small P wave represents the depolarization of the atria. The large QRS complex represents the depolarization of the ventricles, which requires a much stronger impulse because of the larger size of the ventricular cardiac muscle compared to the atria. The ventricles begin to contract as the QRS reaches the peak of the R wave, causing a “heartbeat” that is felt when assessing a client’s pulse. Lastly, the T wave represents the repolarization of the ventricle. Repolarization of the atria occurs soon after the P wave as the Ta wave, but is typically not visible on the EKG since the voltage of the QRS complex is greater than the voltage necessary to repolarize the atria.
Intervals between waveforms are assessed on the EKG. The P-P interval represents the duration between atrial heartbeats. The R-R interval represents the duration between the ventricular heartbeats. Both of these intervals should be consistent if the heart rhythm is regular. However, the P-P interval and the R-R interval may not be the same if a client has a dysrhythmia with different atrial and ventricular heart rates. For example, in atrial flutter the atrial rate will be much faster than the ventricular rate.
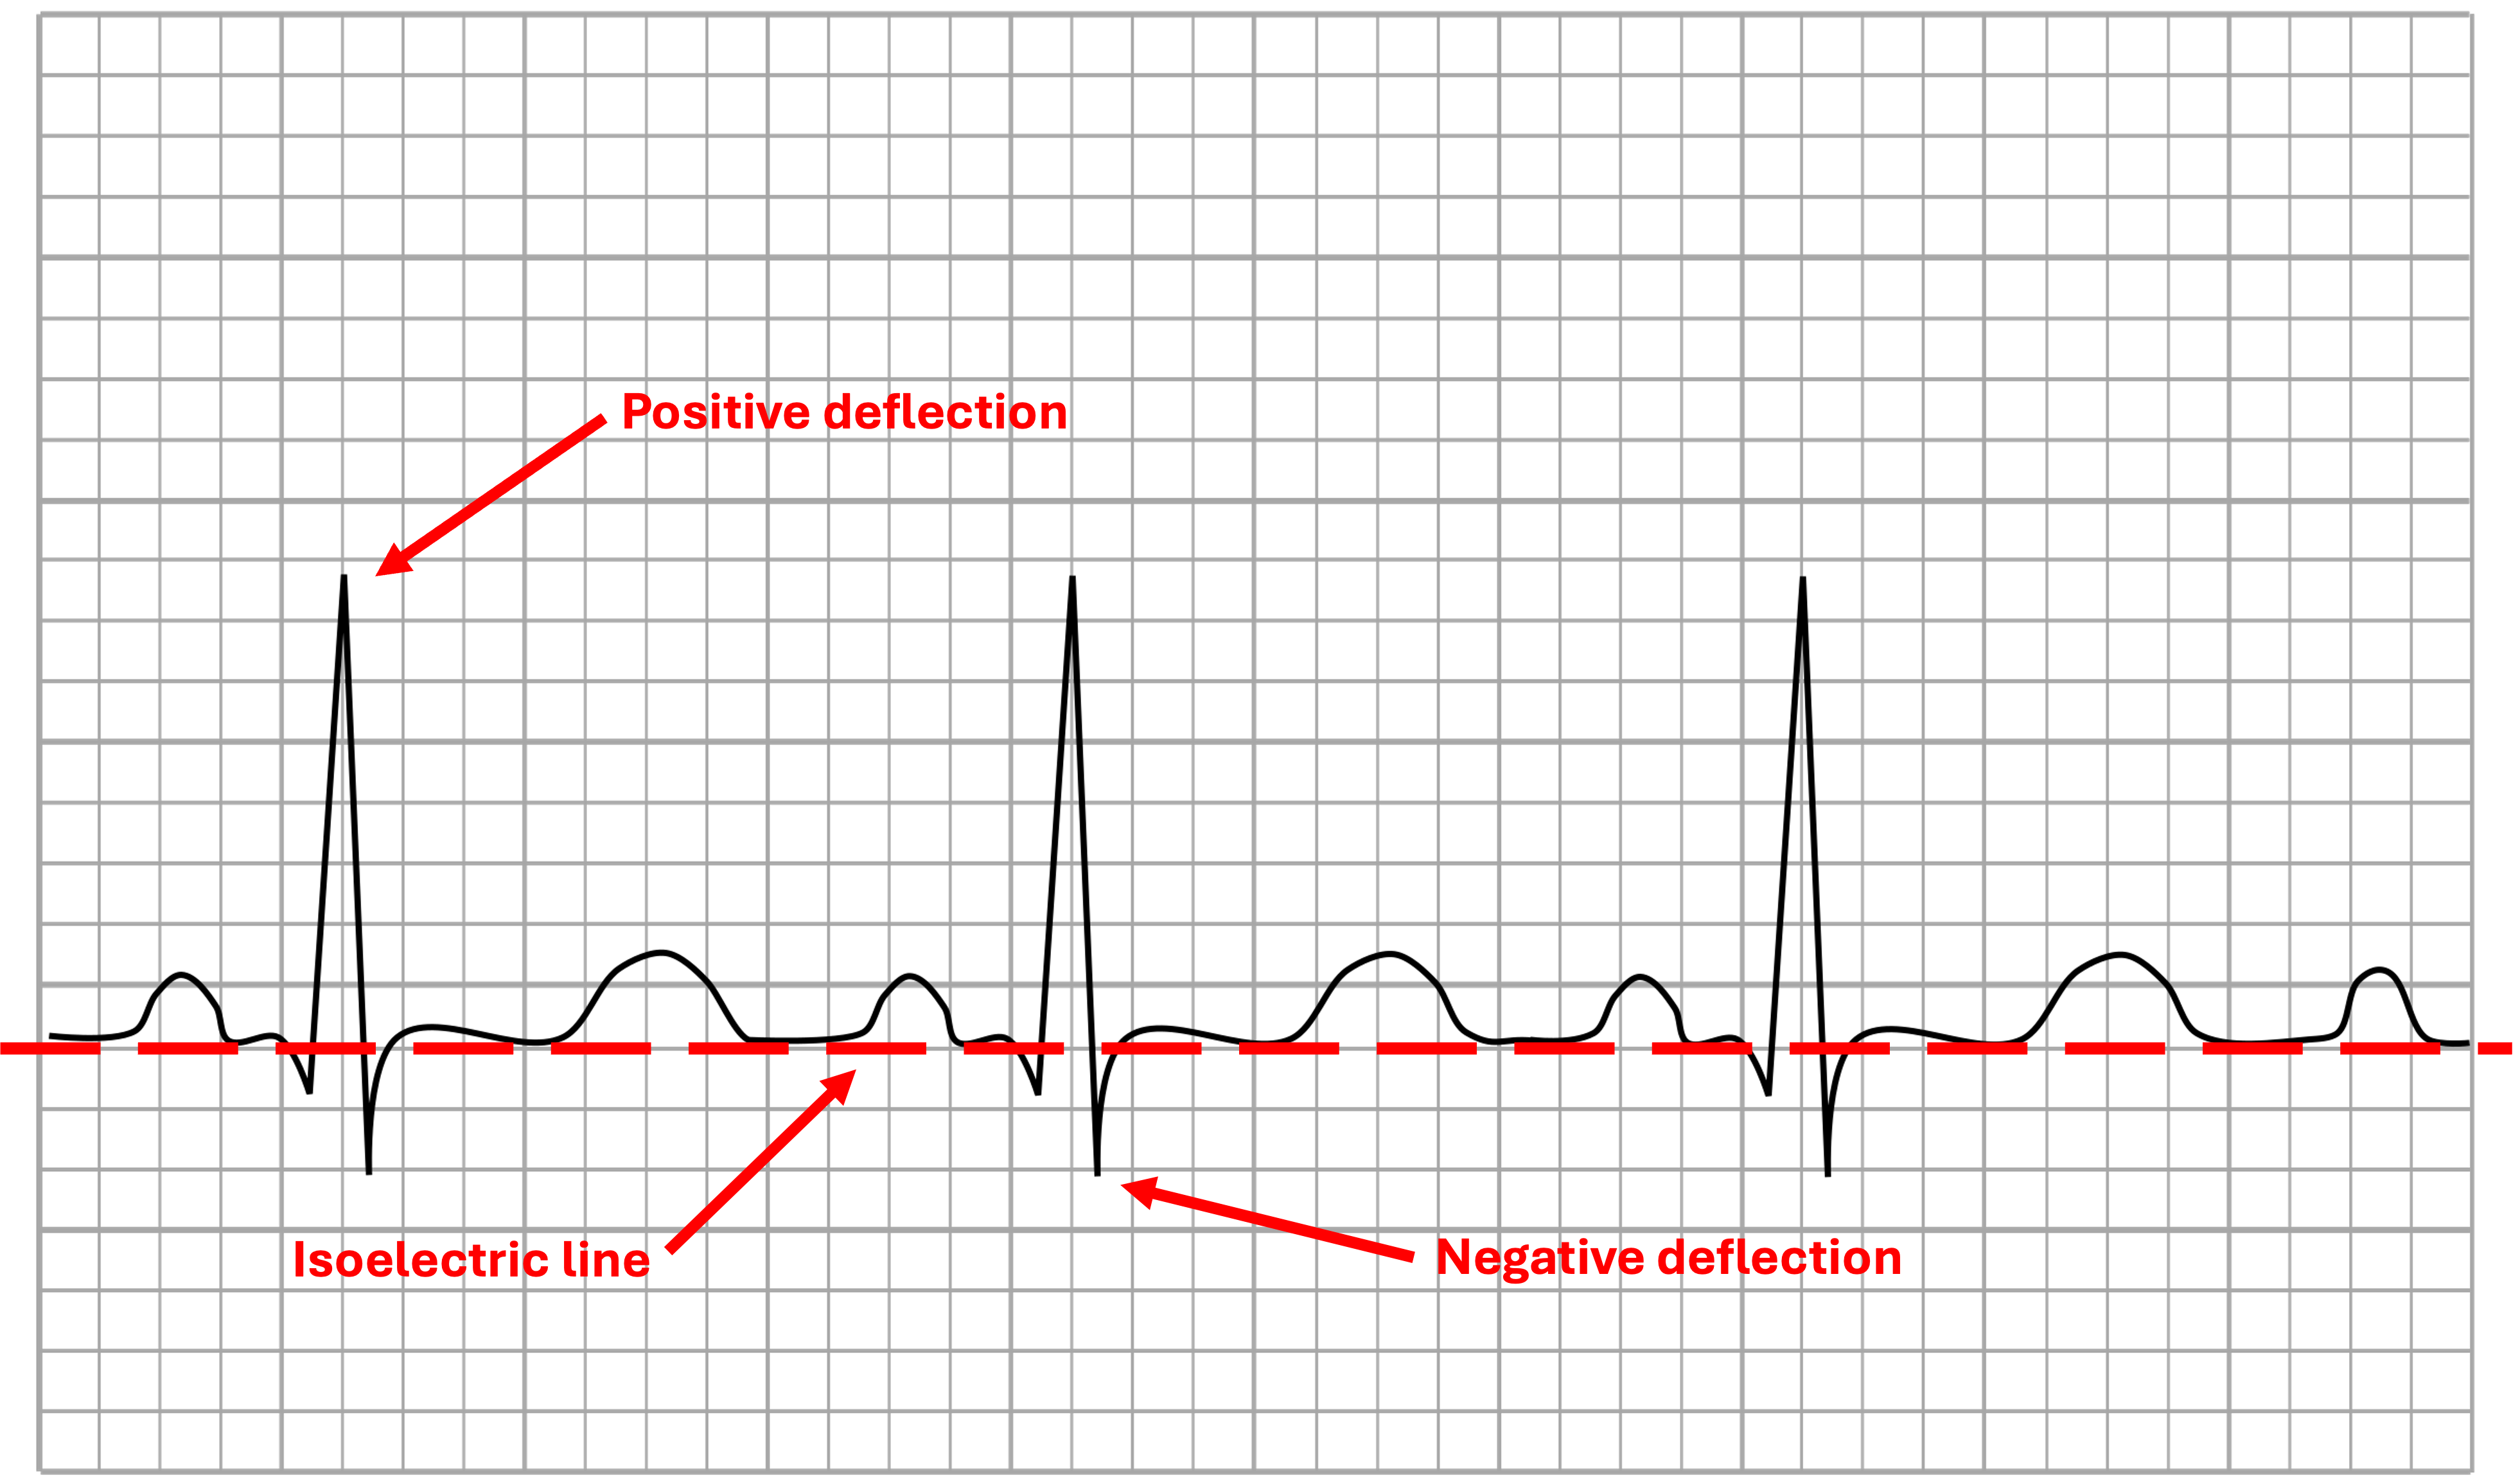
The isoelectric line is used to measure intervals. It is an imaginary line that can be drawn horizontally through the telemetry strip. This is also called the baseline and is used to determine where each component of the heartbeat starts and ends. It also helps to determine if the component has a positive or negative deflection. See Figure 1.11 for an illustration of the isoelectric line.
The PR interval is measured from the start of the P wave to the start of the QRS complex. This is where the P wave starts to have a positive deflection off the isometric line to the first deflection of the QRS complex.
The QRS complex is measured from the first negative deflection (Q) through the upward spike (R) to the second negative deflection (S) once it returns to the isometric line. Depending on which lead is being observed, not all three waves may be visible.
The QT interval is measured from the first negative deflection (Q) to the end of the T wave or where the T wave returns to the isometric line.[2]
Review Basic Concepts
Recap the steps of the cardiac conduction system:
Test your knowledge on the steps of the cardiac conduction system:
Review with these five questions:
Video and Image Attributions:
Fig. 1.1 – “Heart diagram-en” by ZooFari is licensed under CC BY-SA 3.0
Fig. 1.2 – “2004 Heart Wall” by OpenStax College is licensed under CC BY 3.0
Fig. 1.3 – “Diagram of the human heart” by Eric Pierce is licensed under CC BY-SA 3.0
Fig. 1.4 – “C_M3_37” by CCCOnline is licensed under CC BY-SA 4.0. Access for free at https://pressbooks.ccconline.org/bio106/chapter/cardiovascular-levels-of-organization/
Rob Swatski. (2018, April 24). 8-6 Conduction System of the Heart [Video]. YouTube. CC BY 4.0
Fig. 1.5 – This work, “Normal Sinus Rhythm Unlabeled“, is adapted from “De-Nsr (CardioNetworks ECGpedia)” by CardioNetworks, used under CC BY-SA 3.0. Adapted by Andrew Meyerson is licensed under CC BY-SA 3.0
Fig, 1.6 – This work, “ECG Paper v2“, is adapted from “ECG Paper” by MoodyGroove, and the image is dedicated to the public domain under CC0 1.0. “ECG Paper v2” by Markus Kuhn is also dedicated to the public domain under CC0 1.0
Fig. 1.7 – “ECG Sinus Arrhythmia 79 bpm” by Ewingdo is licensed under CC BY-SA 4.0
Fig. 1.8 – “Alex CM4000” by Misscurry is licensed under CC BY-SA 3.0
Fig. 1.9 – “Noise move” by Zorkun is licensed under CC BY-SA 3.0
Fig. 1.10 – This image, “SinusRhythmLabels“, by Anthony Atkielski is dedicated to the public domain under CC0
Fig. 1.11 – This work, “Isoelectric line”, is adapted from “Tachycardia ECG paper” by Madhero88, used under CC BY-SA 3.0. “Isoelectric line” is licensed under CC BY-SA 4.0 by Dr. Joshua E. McGee
- Cleveland Clinic. (2021, August 26). Heart. https://my.clevelandclinic.org/health/body/21704-heart ↵
- This chapter is an adaptation of Nursing Advanced Skills by Chippewa Valley Technical College and is used under CC BY 4.0. Changes include rewriting some of the passages and adding original material. ↵
The innermost layer of the heart wall, lining the interior of the heart chambers and covering the heart valves. It consists of a thin layer of endothelial cells and connective tissue, playing a crucial role in maintaining a smooth surface for blood flow within the heart.
The thick, muscular middle layer of the heart wall, composed of cardiac muscle cells (cardiomyocytes). It is responsible for the contractile force that pumps blood out of the heart chambers and into the circulatory system.
The outermost layer of the heart wall, also known as the visceral layer of the serous pericardium. It provides a protective layer around the heart and contains blood vessels, nerves, and a layer of fat, contributing to the overall structure and function of the heart.
A double-layered sac that surrounds the heart, providing protection and reducing friction between the heart and surrounding structures. The outer layer is the fibrous pericardium, and the inner layer is the serous pericardium, which is further divided into the parietal and visceral layers.
The upper right chamber of the heart that receives deoxygenated blood from the body through the superior and inferior vena cava. It then pumps this blood into the right ventricle.
A large vein that carries deoxygenated blood from the upper half of the body (head, neck, arms, and upper chest) to the right atrium of the heart.
A large vein that carries deoxygenated blood from the lower half of the body (abdomen, pelvis, and lower limbs) to the right atrium of the heart.
The lower right chamber of the heart that receives deoxygenated blood from the right atrium and pumps it into the pulmonary arteries, which carry the blood to the lungs for oxygenation.
Blood vessels that carry deoxygenated blood from the right ventricle of the heart to the lungs. The pulmonary arteries are unique because they are the only arteries in the body that carry deoxygenated blood.
Blood vessels that carry oxygenated blood from the lungs to the left atrium of the heart. The pulmonary veins are unique because they are the only veins in the body that carry oxygenated blood.
The upper left chamber of the heart that receives oxygenated blood from the lungs through the pulmonary veins. It then pumps this blood into the left ventricle.
The lower left chamber of the heart that receives oxygenated blood from the left atrium and pumps it into the aorta, the largest artery in the body, from where the blood is distributed to the rest of the body. The left ventricle has the thickest muscular wall of all the heart chambers because it needs to generate enough force to pump blood throughout the entire body.
Valves located between the atria (upper chambers) and the ventricles (lower chambers) of the heart, which prevent the regurgitation of blood during ventricular contraction. The two main atrioventricular valves are the tricuspid valve on the right side of the heart and the mitral valve on the left.
The atrioventricular valve on the right side of the heart, which separates the right atrium from the right ventricle. It consists of three cusps (flaps) that prevent the regurgitation of blood into the right atrium when the right ventricle contracts.
The atrioventricular valve on the left side of the heart, which separates the left atrium from the left ventricle. Also known as the bicuspid valve, it consists of two cusps that prevent the regurgitation of blood into the left atrium when the left ventricle contracts.
Valves located at the exits of the heart's ventricles, preventing blood from flowing back into the heart after it has been pumped out. The two main semilunar valves are the pulmonary valve and the aortic valve.
The semilunar valve located between the right ventricle and the pulmonary artery, which prevents the regurgitation of blood into the right ventricle after it has been pumped into the pulmonary artery.
The semilunar valve located between the left ventricle and the aorta, which prevents the regurgitation of blood into the left ventricle after it has been pumped into the aorta.
Blood vessels that carry oxygenated blood away from the heart to the body's tissues. Arteries have thick, muscular walls that help manage the high pressure of blood being pumped from the heart.
The largest artery in the body, which originates from the left ventricle of the heart and distributes oxygenated blood to all parts of the body through the systemic circulation.
Arteries that branch off from the aorta and supply oxygenated blood to the heart muscle itself, ensuring that the heart receives the oxygen and nutrients it needs to function.
Blood vessels that carry deoxygenated blood back to the heart from the body's tissues. Veins have thinner walls compared to arteries and often contain valves that prevent the regurgitation of blood.
The smallest and most numerous blood vessels in the body, where the exchange of oxygen, carbon dioxide, nutrients, and waste products occurs between the blood and the body's tissues. Capillaries connect the arterial system to the venous system.
A group of specialized cells located in the right atrium of the heart, often referred to as the heart's natural pacemaker. It initiates the electrical impulses that set the rhythm for the heart, causing the atria to contract and push blood into the ventricles.
A small mass of specialized cardiac tissue located at the junction between the atria and the ventricles. The AV node receives the electrical impulses from the SA node and delays them slightly before passing them to the ventricles, ensuring the atria have time to fully contract before the ventricles do.
A collection of heart muscle cells specialized for electrical conduction that transmits the electrical impulses from the AV node to the point of the apex of the fascicular branches via the bundle branches, which then stimulate the ventricles to contract.
One of the two branches of the Bundle of His that carries electrical impulses to the left ventricle, facilitating coordinated contraction of the left side of the heart.
The other branch of the Bundle of His that carries electrical impulses to the right ventricle, facilitating coordinated contraction of the right side of the heart.
Fine, specialized fibers located within the walls of the ventricles that rapidly conduct electrical impulses from the bundle branches to the muscle cells of the ventricles, causing the ventricles to contract.
A test that records the electrical activity of the heart over a period of time using electrodes placed on the skin. The resulting trace provides information about the heart's rhythm and electrical activity.
A conductive device that is attached to the skin's surface to detect the electrical activity of the heart. Electrodes pick up the electrical signals produced by the heart during each heartbeat, which are then transmitted to an electrocardiograph machine to create a visual representation of the heart's electrical activity, known as an electrocardiogram.
A standard type of EKG that uses 10 electrodes placed on the patient's limbs and chest to record 12 different views of the heart's electrical activity, providing a comprehensive view of the heart's function.
A continuous monitoring system that tracks a patient's heart rhythm over time, often used in a hospital setting to monitor patients with heart conditions remotely.
An abnormal pacemaker site that can interfere with the normal electrical impulses of the heart.
Any abnormality in the rhythm of the heart, whether too fast, too slow, or irregular. Dysrhythmia is often used interchangeably with arrhythmia but generally refers more specifically to any deviation from a normal heartbeat pattern.
A general term for any disturbance or irregularity in the heart's normal rhythm, whether the rate is abnormally fast, slow, or irregular. It can include a wide range of conditions, from harmless irregularities to life-threatening conditions.
Any interference or distortion on an EKG tracing that is not related to the electrical activity of the heart. Artifacts can be caused by patient movement, electrical interference, or loose electrodes, among other factors.
The first deflection on an electrocardiogram that represents the electrical depolarization of the atria.
A combination of three deflections on an electrocardiogram that represents the electrical activity of ventricular depolarization, typically lasting 0.08 to 0.10 seconds in healthy adults.
The deflection on an electrocardiogram that occurs after the QRS complex and represents ventricular repolarization.
The interval between successive R waves on an EKG, representing the time between consecutive atrial contractions.
The interval between successive R waves on an EKG, representing the time between consecutive ventricular contractions. It is used to calculate heart rate.
The flat, baseline of the EKG tracing where there is no electrical activity being detected, often used as a reference point to assess the deflection of various waves (such as the P wave, QRS complex, and T wave).
The time measured from the beginning of the P wave to the beginning of the QRS complex on an electrocardiogram, reflecting the conduction time through the atria and atrioventricular node.
The time measured from the beginning of the QRS complex to the end of the T wave on an electrocardiogram, representing the duration of ventricular depolarization and repolarization.

.png)